Launch the Time Series Platform
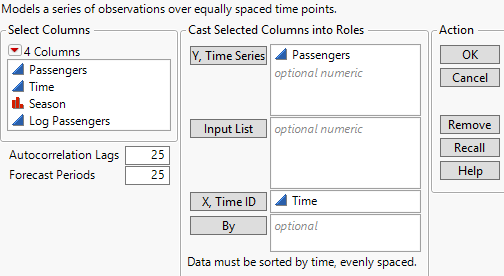
Launch the Time Series platform by selecting Analyze > Specialized Modeling > Time Series. The Time Series launch window for the Seriesg.jmp sample data table is shown in Figure 17.4.
Figure 17.4 The Time Series Launch Window
For more information about the options in the Select Columns red triangle menu, see Column Filter Menu in Using JMP.
The Time Series platform launch window contains the following options:
Y, Time Series
Assigns one or more columns as time series variables. Displayed on the Y axis.
Input List
Assigns one or more columns as input series variables. Displayed in the Input Time Series Panel and used in transfer function models. The input series variable must be numeric, either as a time series or an indicator.
X, Time ID
Assigns one variable for labeling the time axis (X axis). If no variable is specified for Time ID, the row number is used instead.
Note: If you use an X, Time ID variable, you can specify the time frequency by using the Time Frequency column property. You can choose Annual, Quarterly, Monthly, Weekly, Daily, Hourly, By Minute, and By Second. This helps JMP determine the spacing of the data when plotting the forecast values. If no frequency is specified, the data is treated as equally spaced numeric data.
Caution: It is assumed that the observations of the variable assigned to X, Time ID are equally spaced. However, the Time Series platform checks only whether the time stamps are increasing. The platform does not check if the observations are equally spaced.
By
Assigns a column that creates a report consisting of separate analyses for each level of the variable. If more than one By variable is assigned, a separate analysis is produced for each possible combination of the levels of the By variables.
Note: If you use a By variable, you might have to change the number of autocorrelation lags depending on how many observations there are for each level of the By variable. The number of lags must be greater than one but less than the number of observations per level.
Autocorrelation Lags
Specifies the number of lags to use in computing the autocorrelations and partial correlations. This is the maximum number of periods between points used in the computation of these correlations. It must be greater than one but less than the number of rows. The default number of lags is 25.
Tip: A commonly used rule for the maximum number of lags is n/4, where n is the number of observations.
Forecast Periods
Specifies the number of future periods that are forecast using each model fitted to the data. The default number of forecast periods is 25.
Note: In order to preserve the order and spacing of a time series, the Time Series platform treats excluded rows in the data table as missing values.