 Model Specification Report
The Model Specification report contains three panels of controls for specifying your model. When you click OK in the launch window, the default model of independence appears in the View panel of the Model Specification report. The independence model includes all means and variances of the specified Model Variables.
 Specification Panel
The Specifications panel contains controls for building your model.
Model Name
Enables you to specify a name for the model. When you click Run in the Action panel, a model report that uses the text in Model Name is created.
From List
Lists the model variables that were specified in the launch window as well as a Constant term. The Constant term estimates means of any observed or latent variable by regressing each variable on the Constant. Select one or more variables in this list and one or more variables in the To List before clicking one of the arrow buttons to add terms to the model. If you create a latent variable, the latent variable is added to the From List and the To List. You can filter the items in this list using the search filter controls at the top of the list. See Search Filter Options.
To List
Lists the model variables that were specified in the launch window as well as a Constant term. The Constant term estimates means of any observed or latent variable by regressing each variable on the Constant. Select one or more variables in the From List and one or more variables in this list before clicking one of the arrow buttons to add terms to the model. If you create a latent variable, the latent variable is added to the From List and the To List. Variables in the To List must be selected to add latent variables to the model. You can filter the items in this list using the search filter controls at the top of the list. See Search Filter Options.
Unidirectional Arrow 
Specifies the type of relationship between the selected variables in the From List and the To List. The unidirectional arrow is equivalent to a regression effect.
Bidirectional Arrow 
Specifies the type of relationship between the selected variables in the From List and the To List. The bidirectional arrow is equivalent to a covariance effect.
Remove Latent
Removes any latent variables that are currently selected in either the From list or the To list. Removing the latent variables from the From and To lists also removes corresponding variables from the model.
Add Latent
Adds a latent variable to the From and To lists. The variable is named based on the text in the box to the left of the Add Latent button.
Note: You must select indicators for the latent variable in the To List prior to clicking Add Latent.
Model Shortcuts
Contains three options available to quickly build common latent growth curve models. These common latent growth curve models are an intercept-only model, a linear model, and a quadratic model. Note that when you select one of these options, all currently specified settings are cleared.
 View Panel
The View panel enables you to switch between a diagram view, a list view, and a status view of the current model specification.
Diagram Tab
The Diagram tab contains a model diagram that enables you to visualize the currently specified model. Latent variables are represented by circles, and manifest variables are represented by rectangles. Unidirectional arrows represent loadings and regressions. Bidirectional arrows represent variances and covariances. A variance is specified by a bidirectional arrow from one variable to itself. A covariance is specified by a bidirectional arrow between two variables.
You can customize the path diagram by dragging items in the diagram, by using the buttons in the Diagram panel, and by using the Path Diagram options. See Details and Diagram Panels and Path Diagram.
Tip: To copy the path diagram as an image, right-click the diagram and select Copy Graph to Clipboard.
Lists Tab
The Lists tab contains lists for each type of variable in the model. They are categorized by the arrows that are used to represent them in the model diagram. Unidirectional arrows are used to designate means or intercepts, loadings, and regressions. Bidirectional arrows are used to designate variances and covariances. Means and intercepts for the model appear only in the Lists tab and not in the Diagram tab.
You can filter the items in each list using the search filter controls at the top of each list. See Search Filter Options.
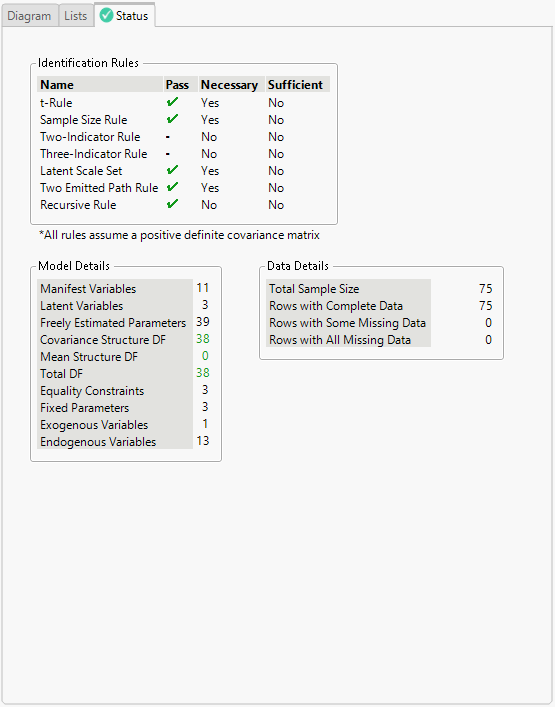
Status Tab
The Status tab contains checks for model identifiability. Structural equation models must be identified to obtain reliable estimates. Identification in the context of SEM means that one can derive unique solutions for every parameter in the model based on the population covariance matrix of the input data. Because you can specify such a variety of models in the SEM framework, there are a variety of rules for identifiability. The Status tab consists of three panels of information: Identification Rules, Model Details, and Data Details.
• The Identification Rules panel contains a list of up to eight rules that are appropriate for a specified model. Some rules are necessary and others are sufficient to guarantee model identification. If necessary rules fail, steps must be taken to correct them before fitting the model. If sufficient rules fail, you do not necessarily need to address any issues. Sometimes sufficient rules can fail without being evidence of anything wrong with the model. Note that all of the rules assume a positive definite covariance matrix. If the covariance matrix is not positive definite, a warning appears below the Model Details panel.
Tip: For more information about a particular identification rule, click on the row of the table for the rule and a description of the rule appears to the right of the table.
• The Model Details panel contains a list of descriptive values for the currently specified model. These values can be used to detect potential issues with the model.
• The Data Details panel contains a list of descriptive values for the input data. These values can be used to detect potential issues with the data.
If there are singularities in the specified data columns, the report contains a Singularity Details table.
The Status tab itself contains a dynamic icon that shows the current status of the specified model. The icon designates the status:

All applicable identification rules pass.

At least one necessary identification rule does not pass and you must take steps to correct the issues before fitting the model.

At least one non-necessary identification rule does not pass and further investigation is needed to determine whether the model is correctly specified. Oftentimes, advanced applications of SEM lead to this situation; this does not suggest a problem with the model. Rather, it suggests that the identification rules cannot guarantee that the model is identified.
Figure 8.6 Example Status Tab
 Action Panel
The buttons in the Action panel operate on the lists of specified model variables in the Lists tab. The following operations are available:
Run
Fits and creates a report for the currently specified model.
Fix To
Enables you to fix the parameter value of the currently selected effects to a constant value. When you fix the parameter value for a variable, the fixed value appears in parentheses after the name of the term.
Note: If you keep the default value of 0 when you click OK, the selected effects are removed from the model.
Set Equal
Enables you to constrain the parameter values of two or more selected effects to be equal. When you set two or more effects to have equal parameter values, an arbitrary alphanumeric label (“c1”) appears in parentheses after the names of the terms. In the case of multiple sets of effects that have parameter values that are set equal to each other, sequential numbering is used (“c1”, “c2”, and so on).
Note: Equality constraints are allowed only within the same type of parameters.
Free
Enables you to remove restrictions on the selected effects in the model. Restrictions include effects that have been set to a fixed value or effects that have been set equal to other effects.
Remove
Removes the selected effects from the model.
Undo
Undoes the last modification to the model.
Reset
Resets the model specification to the independence model, which is the default.
 Details and Diagram Panels
The Details panel contains information about the model that is currently specified in the Model Specification report. Information about the model includes the number of manifest variables, number of latent variables, number of freely estimated parameters, and number of degrees of freedom. You can also adjust the maximum number of iterations.
Note: The note Means in Lists tab indicates that the model means and intercepts appear only in the Lists tab and not in the Diagram tab.
The Diagram panel contains buttons that enable you to adjust the layout of the model diagram. The first button enables you to rotate the manifest variables (represented by rectangles) in the diagram. The second button enables you to cycle through six different arrangements of the diagram.
 Search Filter Options
The From List, To List, and the list boxes that appear in the Lists tab in the Model Specification report contain search filters that enable you to filter the items in a specific list.
Click the down arrow button next to the search box to refine your search.
Contains Terms
Returns items that contain a part of the search criteria. A search for “ease oom” returns messages such as “Release Zoom”.
Contains Phrase
Returns items that contain the exact search criteria. A search for “text box” returns entries that contain “text” followed directly by “box” (for example, “Context Box” and “Text Box”).
Starts With Phrase
Returns items that start with the search criteria.
Ends With Phrase
Returns items that end with the search criteria.
Whole Phrase
Returns items that consist of the entire string. A search for “text box” returns entries that contain only “text box”.
Regular Expression
Enables you to use the wildcard (*) and period (.) in the search box. Searching for “get.*name” looks for items that contain “get” followed by one or more words. It returns “Get Color Theme Names”, “Get Name Info”, and “Get Effect Names”, and so on.
Invert Result
Returns items that do not match the search criteria.
Match All Terms
Returns items that contain both strings. A search for “t test” returns elements that contain either or both of the search strings: “Pat Test”, “Shortest Edit Script” and “Paired t test”.
Ignore Case
Ignores the case in the search criteria.
Match Whole Words
Returns items that contain each word in the string based on the Match All Terms setting. If you search for “data filter”, and Match All Terms is selected, entries that contain both “data” and “filter” are returned.