Normal Mixtures Report Options
Biplot
Shows a plot of the points and clusters in the first two principal components of the data, along with a legend identifying the cluster colors. Circles are drawn around the cluster centers and the size of the circles is proportional to the count inside the cluster. The shaded area is the density contour around the mean. By default, this area indicates where 90% of the observations in that cluster would fall (Mardia et al. 1980). Use the list below the plot to change the plot axes to other principal components. Alternatively, use the arrow button to cycle through all possible axes combinations. An option to save the cluster colors to the data table is also located below the plot. See Save Colors to Table. The eigenvalues are shown in decreasing order.
Note: The biplot always uses the correlation matrix to calculate the principal components.
Biplot Options
Contains options for controlling the appearance of the Biplot.
Show Biplot Rays
Shows the biplot rays. The labeled rays show the directions of the covariates in the subspace defined by the principal components. They represent the degree of association of each variable with each principal component.
Biplot Ray Position
Enables you to specify the position and radius scaling of the biplot rays. By default, the rays emanate from the point (0,0). In the plot, you can drag the rays or use this option to specify coordinates. You can also adjust the scaling of the rays to make them more visible with the radius scaling option.
Biplot Contour Density
Enables you to specify the confidence level for the density contours. The default confidence level is 90%.
Mark Clusters
Assigns markers that identify the clusters to the rows of the data table.
Biplot 3D
Shows a three-dimensional biplot of the data. Available only when there are three or more variables.
Parallel Coord Plots
Creates a parallel coordinate plot for each cluster. The plot report has options for showing and hiding the data and means. See Parallel Plots in Essential Graphing.
Scatterplot Matrix
Creates a scatterplot matrix using all of the Y variables.
Save Colors to Table
Assigns colors that identify the clusters to the rows of the data table. If there is a Biplot in the report window, the colors saved to the data table match the colors of the clusters in the Biplot. If the colors are changed in the Biplot and the Save Colors To Table option is selected again, the colors in the table update to match those in the Biplot.
Note: When any of the Save options are selected, each saved column contains a Notes column property that specifies the number of clusters for that particular column’s data. This enables you to save columns from more than one cluster fit and use the column property to identify which clustering fit the saved column is from.
Save Clusters
Adds a column called Cluster that contains the number of the cluster to which the given row is assigned to the data table. For normal mixtures, this is the cluster that is most likely.
Save Cluster Formula
Adds a formula column called Cluster Formula to the data table. This formula identifies which cluster the row belongs to.
Publish Cluster Formulas
Publishes to the Formula Depot the same scoring code used in the Save Cluster Formula option. If Publish Cluster Formulas is selected and Run Script is chosen from the model within the Formula Depot, the columns saved to the data table should match those that are saved when Save Cluster Formula is selected.
Save Mixture Probabilities
Adds a column called Prob Cluster <k> for each cluster that contains the probability an observation belongs to that cluster.
Save Mixture Formulas
Adds columns to the data table that contain the formulas used to calculate the mixture probabilities. Use these formula columns to score probabilities for excluded data, or data that you add to the table.
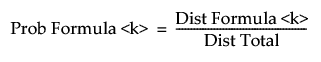
Dist Formula <k>
The estimated multivariate normal density function for Cluster <k> evaluated at the observation.
Dist Total
The sum of the distance formula columns. The formula in this column is equivalent to the formula in the Mixture Density column created by the Save Density Formula option.
Prob Formula <k>
The probability that the observation belongs to Cluster <k>. These columns contain the formulas that give the values in the Prob Cluster <k> columns created by the Save Mixture Probabilities option. The column formula for calculating the mixture probabilities is:
Save Density Formula
Adds a column called Mixture Density that contains the estimated density function for the normal mixture to the data table.
Simulate Clusters
Uses the mixture density to simulate predictor values. Saves these and the clusters into which they are classified in a new data table.
Remove
Removes the clustering report.