Prediction Variance Surface
The Prediction Variance Surface report plots the relative prediction variance surface as a function of any two design factors. Figure 15.21 shows the Prediction Variance Surface outline for the Bounce Data.jmp sample data table, located in the Design Experiment folder. Show or hide the controls by selecting Control Panel on the red triangle menu. See Control Panel.
Figure 15.21 Prediction Variance Surface
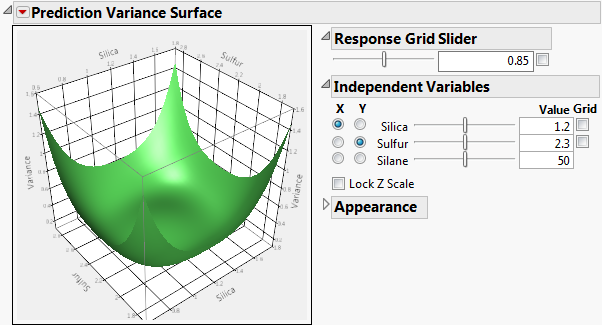
When there are two or more factors, the Prediction Variance Surface outline shows a plot of the relative prediction variance for any two variables. The Prediction Variance Surface outline plots the relative prediction variance formula. Drag on the plot to rotate and change the perspective.
Control Panel
The Control Panel consists of the following:
Response Grid Slider
The Grid check box superimposes a grid that shows constant values of Variance. The value of the Variance is shown in the text box. The slider enables you to adjust the placement of the grid. Alternatively, you can enter a Variance value in the text box. Click outside the box to update the plot.
Independent Variables
This panel enables you to select which two factors are used as axes for the plot and to specify the settings for factors not used as axes. Select a factor for each of the X and Y axes by clicking in the appropriate column. Use the sliders and text boxes to specify values for each factor not selected for an axis. The plot shows the three-dimensional slice of the surface at the specified values of the factors that are not used as axes in the plot. Move the sliders to see different slices.
Each grid check box activates a grid for the corresponding factor. Use the sliders to adjust the placement of each grid.
Lock Z Scale locks the z-axis to its current values. This is useful when moving the sliders that are not on an axis.
Appearance
The Resolution slider affects how many points are evaluated for a formula. Too coarse a resolution means that a function with a sharp change might not be represented very well. But setting the resolution high can make evaluating and displaying the surface slower.
The Orthographic projection check box shows a projection of the plot in two dimensions.
The Contour menu controls the placement of contour curves. A contour curve is a set of points whose Response values are constant. You can select to turn the contours Off (the default) or place them contours Below, Above, or On Surface.