Process Capability for a Stable Process
In this example, you verify the assumptions that enable you to estimate PPM defective rates based on a capability analysis. You access Process Capability through Control Chart Builder and then directly. The data consist of 22 subgroups of size five. There are six missing readings, with three in each of two consecutive subgroups.
Process Capability through Control Chart Builder
You can use Control Chart Builder to check process stability and the normality assumption for your process characteristic. You can also obtain Process Capability information directly within Control Chart Builder.
1. Select Help > Sample Data Library and open Quality Control/Clips2.jmp.
2. Select Analyze > Quality and Process > Control Chart Builder.
3. Drag Date to the Subgroup zone.
4. Drag Gap to the Y zone.
Figure 7.21 XBar and R Control Chart for Gap
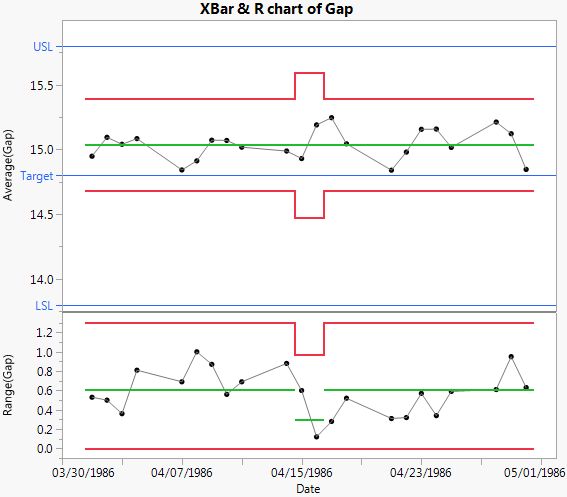
The control chart indicates that Gap is stable over time. Because Gap has the Spec Limits column property, a Process Capability Analysis report appears to the right of the control chart.
Figure 7.22 Histogram in Process Capability Analysis for Gap
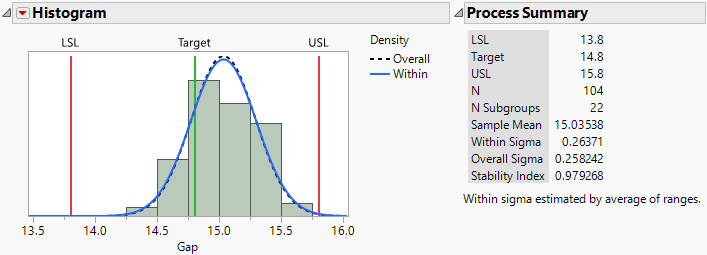
The histogram and fitted normal blue curve suggest that the distribution of Gap is approximately normal. Although the process is stable, the distribution of Gap is shifted to the right of the specification range.
The Process Summary report shows the specification limits that are saved to the Spec Limits column property. It also shows that the estimate of sigma calculated from within-subgroup variation (Within Sigma) does not differ greatly from the overall estimate given by the sample standard deviation (Overall Sigma). Consequently, the Stability Index is near one (0.979268). This is expected because the process is stable.
5. Right-click in the body of the Nonconformance report and select Expected Within PPM from the Columns submenu.
Figure 7.23 Capability Indices and Nonconformance Report
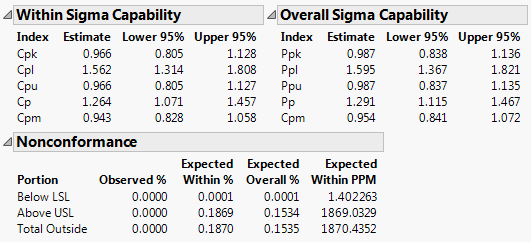
The Cpk value calculated using subgroup variation is 0.966, indicating that the process is not very capable. The Cpl value suggests good performance, but this is because the process is shifted away from the lower specification limit. Defective parts generally result from large values of Gap.
Note that the confidence interval for Cpk is wide; it ranges from 0.805 to 1.128. This occurs even though there are 104 observations. Capability indices are surprisingly variable, due to the fact that they are ratios. It is easy to reach incorrect conclusions based on the point estimate of a capability index.
The estimates of out-of-specification product given in the Nonconformance report provide a direct measure of process performance. The PPM values in the Nonconformance report indicate that Gap hardly ever falls below the lower specification limit (1.4 parts per million). However, the number of parts for which Gap falls above the upper specification limit is 1869.0 parts per million.
For an uncentered process, the Cp value indicates potential capability if the process were adjusted to be centered. If this process were adjusted to be centered at the target value of 14.8, then its capability would be 1.264, with a confidence interval from 1.071 to 1.457.
Process Capability Platform
Now that you have verified stability and normality for Gap, you can obtain additional information in the Process Capability platform.
1. Select Analyze > Quality and Process > Process Capability.
2. Select Gap and click Y, Process.
3. Open the Process Subgrouping outline.
4. Select Date in the Select Columns list and Gap in the Roles list.
5. Click Nest Subgroup ID Column.
By default, the Within-Subgroup Variation Statistic selection is set to Average of Unbiased Standard Deviations. In the Control Chart Builder example (Process Capability through Control Chart Builder), subgroup ranges were used.
6. Click OK.
Figure 7.24 Goal Plot and Box Plot for Gap
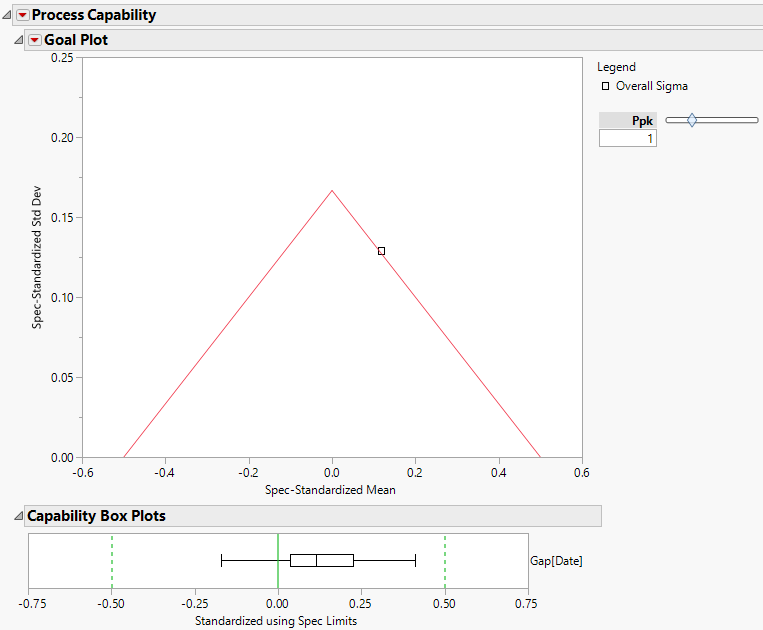
The Goal Plot shows the Ppk index for Gap as being essentially equal to 1. The box plot shows that most values fall within specifications, but the preponderance of data values are shifted to the right within the specification range.
7. Click the Process Capability red triangle and select Individual Detail Reports.
The report is the one obtained using Control Chart Builder, except that the Within Sigma is based on average standard deviations rather than average ranges. See Histogram in Process Capability Analysis for Gap and Capability Indices and Nonconformance Report.