Scaled Estimates and the Coding of Continuous Terms
A parameter estimate is highly dependent on the scale of its corresponding factor. When you convert a factor from grams to kilograms, its parameter estimate changes by a multiple of a thousand. When you apply the same change to a squared (quadratic) term, its parameter estimate changes by a multiple of a million.
To better understand and compare effect sizes, you should examine parameter estimates in a scale-invariant fashion. It makes sense to use a scale that relates the size of a parameter estimate to the size of the effect of its corresponding term on the response. There are many approaches to doing this.
The Effect Screening > Scaled Estimates option in the report’s red triangle menu gives coefficients corresponding to scaled factors. The factors are scaled to have a mean of zero and a range of two. Figure 3.42 shows a report for Drug.jmp.
If the sample values for the factor are such that the maximum and minimum values are equidistant from the sample mean, then the scaled factor ranges from –1 to 1. This scaling corresponds to the traditional coding used in the design of experiments. In the case of regression with a single factor, the scaled parameter estimate is half of the predicted response change as the factor travels its whole range.
Scaled estimates are important in assessing the impact of model terms when the data involve uncoded values. For orthogonal designs, the scaled estimates are identical to the estimates for the uncoded data.
Note: The Coding column property scales factor values linearly so that their coded values range from –1 to 1. Parameter estimates are given in terms of these coded values, so that scaled estimates are not required in this situation. (Unlike the transformation used to obtain scaled estimates, the coded values might not have mean zero.)
Example of Scaled Estimates
1. Select Help > Sample Data Library and open Drug.jmp.
2. Select Analyze > Fit Model.
3. Select y and click Y.
4. Select Drug and x and add these to the Construct Model Effects list.
5. Change the Emphasis to Minimal Report.
6. Click Run.
7. Click the Response y red triangle and select Effect Screening > Scaled Estimates.
The report indicates that the continuous factor, x, is centered by its mean and scaled by its half-range.
Figure 3.42 Scaled Estimates Report
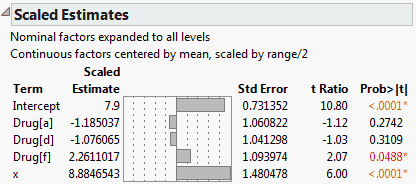
The model fits three parallel lines, one for each Drug group. The x values range from 3 to 21. The Scaled Estimate for x, 8.8846543, is half the difference between the predicted value for x = 21 and the predicted value for x = 3 for any one of the Drug groups. You can verify this fact by selecting Save Columns > Prediction Formula from the report’s red triangle menu. Then add rows to obtain predicted values for each of the Drug groups at x = 21 and x = 3.
So, over the range of x values in this particular data set, the impact of x is to vary the response over a range of about 17.8 units. Note that the parameter estimate for x based on the raw data is 0.9871838; it does not permit direct interpretation in terms of the response.