Publication date: 04/30/2021
Scatterplot Matrix
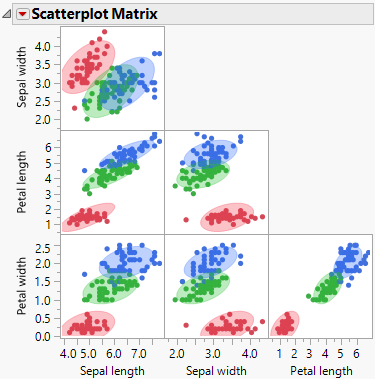
The Scatterplot Matrix command invokes the Scatterplot Matrix platform in a separate window containing a lower triangular scatterplot matrix for the covariates. Points are plotted for all observations in the data table.
Ellipses with 90% coverage are shown for each level of the categorical variable X. For the Linear discriminant method, these are based on the pooled within covariance matrix. Figure 5.17 shows the Scatterplot Matrix window for the Iris.jmp sample data table.
Figure 5.17 Scatterplot Matrix for Iris.jmp
The options in the Scatterplot Matrix red triangle menu are described in Essential Graphing.
Want more information? Have questions? Get answers in the JMP User Community (community.jmp.com).