Statistical Details for Individual Observations
Consider measurements that are not sub-grouped, that is, where the natural subgroup size is n = 1. Denote the number of observations by m and the number of variables measured by p. A T2 statistic is calculated and plotted for each observation. The calculation of the T2 statistic and upper control limit (UCL) depends on the source of the target statistics. In a Phase I chart, the limits are based on the same data that is being plotted on the control chart. In a Phase II chart, the limits are based on target statistics that were calculated from a historical data set. For more information about T2 statistic and control limit calculations for Hotelling T2 control charts, see Montgomery (2013).
Calculations for Phase I Control Charts
In Phase I control charts, the T2 statistic for the ith observation is defined as follows:
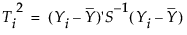
where:
Yi is the column vector of p measurements for the ith observation
 is the column vector of sample means of the p variables
S-1 is the inverse of the sample covariance matrix
The Ti2 value for each of the i observations are the points plotted on the multivariate control chart.
When computing Phase I control limits, the UCL is based on the beta distribution. Specifically, the upper control limit (UCL) is defined as follows:
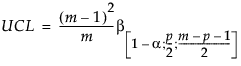
where:
p = number of variables
m = number of observations
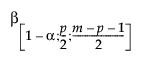 = (1–α)th quantile of a Beta
  distribution
Calculations for Phase II Control Charts
In Phase II control charts, define the historical data set as X. Then the T2 statistic for the ith observation is defined as follows:
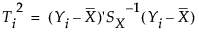
where:
Yi is the column vector of p measurements for the ith observation
 is the column vector of sample means of the p variables, calculated from the historical data set
SX-1 is the inverse of the sample covariance matrix, calculated from the historical data set
The Ti2 value for each of the i observations are the points plotted on the multivariate control chart.
When computing Phase II control limits, new observations are independent of the historical data set. In this case, the upper control limit (UCL) is a function of the F distribution and partially depends on the number of observations in the historical data set from which the targets are calculated. The UCL is defined as follows:
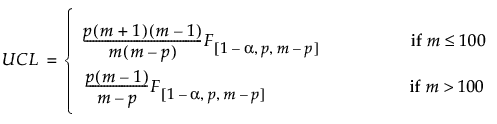
where:
p = number of variables
m = number of observations in the historical data set
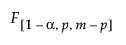 = (1–α)th quantile of an F
 distribution