Step 1: Launching a Platform and Viewing Results
1. Select Help > Sample Data Library and open Companies.jmp.
2. Select Analyze > Distribution to open the Distribution launch window.
3. Select Profits ($M) in the Select Columns box and click the Y, Columns button.
The variable Profits ($M) appears in the Y, Columns role.
Another way to assign variables is to click and drag columns from the Select Columns box to any of the roles boxes.
Figure 2.5 Assign Profits ($M)
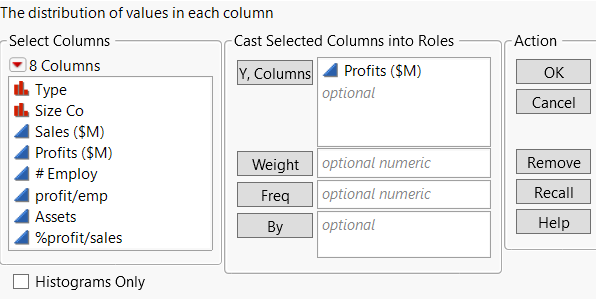
4. Click OK.
The Distribution report window appears.
Figure 2.6 Distribution Report Window on Windows
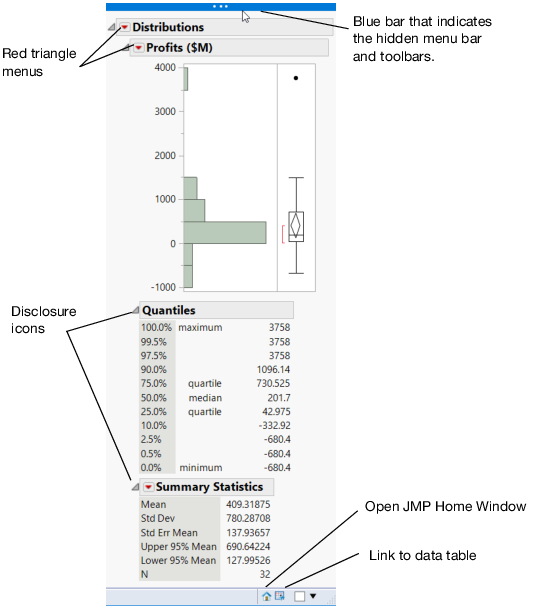
The report window contains basic plots or graphs and preliminary analysis reports. The results appear in an outline format, and you can show or hide any report by clicking on the disclosure icon.
Red triangle menus contain options and commands to request additional graphs and analyses at any time.
• On Windows, place your mouse pointer over the blue bar at the top of the window to see the menu bar and the toolbars.
• On Windows, click the data table button in the lower right corner to view the data table that was used to create this report. On macOS, click the Show Data Table button in the upper right corner of the report window.
• On Windows, click the JMP Home Window button in the lower right corner to view the Home Window. On macOS, select Window > JMP Home.