Ternary Plot Overview
A ternary plot is a two-dimensional representation of three mixture components that sum to a constant. The plot is an equilateral triangle with an edge for each component. When unconstrained, each vertex of the triangle corresponds to a pure blend where one component is 1 (100%) and all other components are 0. When components are constrained, the feasible mixtures are represented by a portion of the ternary plot. Shading is used to exclude infeasible portions of the plot.
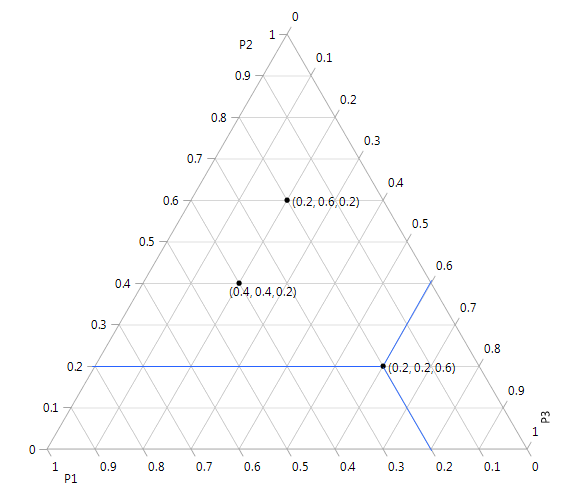
Figure 6.2 displays three components P1, P2, and P3. The three components are unconstrained with the range of each proportion ranging from 0 to 1 (100%). Three points are labeled with their coordinates (P1, P2, P3). One point (0.2, 0.2, 0.6) includes blue lines along the axis grid lines for each mixture component to guide you in reading the axes.
Figure 6.2 Ternary Plot Example