Test Parallelism
The Test Parallelism option provides an analysis for testing if the fitted models between groups have the same shape, but are shifted along the X axis (Figure 13.9). In the Bioassay example, the curve for drug formulation B is shifted to the left of the other three curves. However, you do not know whether the curves still have the same shape (are parallel), or if formulation B is different. The Parallelism Test tells us if the shapes for the different drug formulations have similar shapes and are shifted along the horizontal axis. Select Test Parallelism from the fitted model’s red triangle menu to add the report.
Figure 13.9 Parallelism Test
The report gives the following results:
Test Results
Gives the results of an F Test and a Chi-Square Test for parallelism. The tests compare the error sums-of-squares for a full model (Full SSE) and a reduced model (Fit SSE). The full model gives each group different parameters. The reduced model forces the groups to share every parameter except for the inflection point. A small p-value indicates that the group models are significantly different from one another. Therefore, the reduced model with shared parameters is insufficient and the full model should be used. In Figure 13.9, the p-value is greater than 0.05, indicating that there is not enough evidence to conclude that differences exist between the curves. In this case, the reduced model with shared parameters is appropriate.
The fit statistics are calculated as follows:
F Ratio
[(Fit SSE - Full SSE) / NDF] / [Full SSE / DDF]
ChiSquare
Fit SSE - Full SSE
Parallel Fit Parameter Estimates
Gives the parameter estimates under the reduced model (same parameters, except for inflection point). A plot of the fitted curves under the reduced model is provided. The inflection point for drug formulation B is much lower than that of the other three drug formulations.
Relative Potencies
Gives the potency and relative potency for each level of the grouping variable. The potency is 10^(EC50), where EC50 is the concentration at which the response half way between baseline and maximum is obtained. For the Logistic 2P, 3P, and 4P, the potency is 10^(inflection point parameter). The relative potency is the potency of one level of the grouping variable divided by the potency of another level. For example, in Figure 13.10, the relative potency of test A to standard is Potencytest A/Potencystandard.
Figure 13.10 Relative Potencies by Group
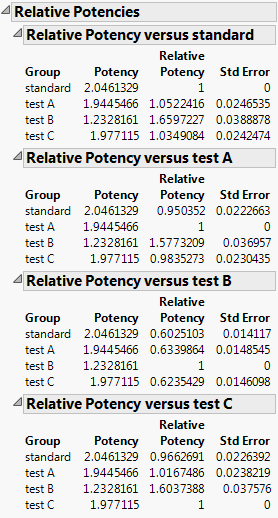
In the Relative Potency versus standard panel from Figure 13.10, note that the relative potencies for drug formulations A and C are nearly one. This indicates that their potencies are similar to that of the standard formulation. The potency for drug formulation B is lower than that of the standard. This means that drug formulation B increases in toxicity as a function of concentration faster than the standard.
In the parallelism test, the curves are parallel, which enables you to calculate relative potencies. Based on the relative potencies, you conclude that formulation B is more potent than the other drug formulations. Taken with the prior findings, drug formulation B appears to be more toxic.