The Cumulative Damage Report
After you click OK, the Cumulative Damage report window appears. By default, the Cumulative Damage report contains an event plot, a stress patterns report, a model list, and model results.
Event Plot
The Event Plot in Cumulative Damage displays time to failure or censoring. See Event Plot in the Life Distribution section.
Stress Patterns Report
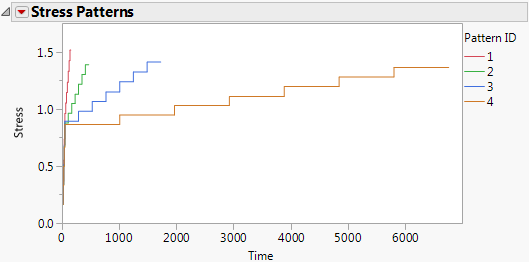
The Stress Patterns report shows a plot of the stress level over time for each of the stress pattern IDs. The Simulate option in this report enables you to simulate new data. Figure 5.6 shows an example of the Stress Patterns report plot. See Stress Patterns Options.
Figure 5.6 Stress Patterns Report
Model List
The Model List report provides the -2Loglikelihood, number of parameters, AICc, and BIC statistics for each fitted distribution. Smaller values of each of these statistics (other than number of parameters) indicate a better fit. For more information about these statistics, see Likelihood, AICc, and BIC in Fitting Linear Models.
Model Results
The Results report contains a separate report for each fitted distribution. Each report contains the following:
Parameter Estimates
Shows the estimates, standard errors, and Wald-based 95% confidence intervals.
The fitted equation appears below the Parameter Estimates table. This equation takes into account the fitted parameter estimates and the relationship specified in the launch window.
Distribution Profiler
Shows cumulative failure probability as a function of time.
Quantile Profiler
Shows failure time as a function of cumulative probability.
Hazard Profiler
Shows the hazard rate as a function of time.
Density Profiler
Shows the density function for the distribution.
Probability Plot of Standardized Residuals
Shows a plot of standardized residuals for the model on a probability scale axis.
The Probability Plot of Standardized Residuals red triangle menu has a Save Residuals option that saves the standardized residuals to three new columns in the failure time data table. The three columns are Left Residuals, Right Residuals, and Residual Weight.
Cox-Snell Residual P-P Plot
Shows a residual plot that is used to validate the distributional assumption for the data.
The Cox-Snell Residual P-P Plot red triangle menu has a Save Residuals option that saves the Cox-Snell residuals to three new columns in the failure time data table. The three columns are Left Residuals, Right Residuals, and Residual Weight. See Meeker and Escobar (1998, sec. 17.6.1) for a discussion of Cox-Snell residuals.