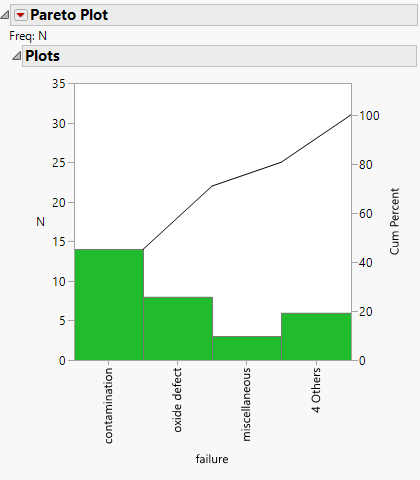
Threshold of Combined Causes Example
This example uses the Failure.jmp sample data table, which contains failure data and a frequency column. It lists causes of failure during the fabrication of integrated circuits and the number of times each type of defect occurred. A threshold value of 2 is specified for this example.
1. Select Help > Sample Data Library and open Quality Control/Failure.jmp.
2. Select Analyze > Quality and Process > Pareto Plot.
3. Select failure and click Y, Cause.
4. Select N and click Freq.
5. Select Threshold of Combined Causes and then select Count.
6. Enter 2 as the threshold value.
7. Click OK.
Figure 13.8 Pareto Plot with a Threshold Count of 2
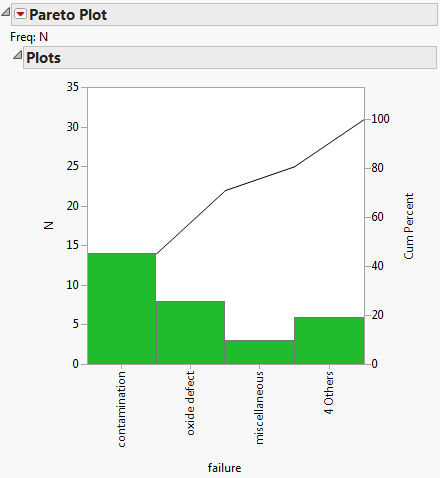
Figure 13.8 displays the plot after specifying a count of 2. All causes with counts 2 or fewer are combined into the final bar labeled 4 Others.
8. To separate the combined bars into original categories as shown in Figure 13.9, select Causes > Separate Causes.
Figure 13.9 Pareto Plot with Separated Causes