Nonpar Density
When a plot shows thousands of points, the mass of points can be too dark to show patterns in density. Using the Nonpar Density (nonparametric density) option makes it easier to see the patterns.
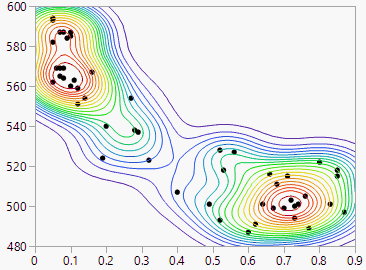
Nonpar Density estimates a smooth nonparametric bivariate surface that describes the density of data points. The plot adds a set of contour lines showing the density (Figure 5.16). The contour lines are quantile contours in 5% intervals. This means that about 5% of the points generated from the estimated nonparametric distribution are below the lowest contour, 10% are below the next contour, and so on. The highest contour has about 95% of the points below it.
Figure 5.16 Example of Nonpar Density
To change the size of a nonparametric density contour grid, press Shift and select Nonpar Density from the Bivariate red triangle menu. Enter a larger value than the default 102 points.
For more information about the options in the Quantile Density Contours menu, see Fitting Menus.
Quantile Density Contours Report
The Quantile Density Contours report shows the standard deviations used in creating the nonparametric density.
