Summary Reports
The Summary Report options show or hide a table that contains the following statistics for each variable: LSL, Target, USL, Sample Mean, various Sigma estimates, Stability Index, Cpk, Cpl, Cpu, Cp, Cpm, and Nonconformance statistics. If there is at least one nonmissing process importance value, an Importance column is also included in the Summary Report. These statistics are calculated using the sigma estimate specified in the report title. The columns for Stability Index, Cpk, Cpl, Cpu, and Cp are colored as green, yellow, and red to indicate adequate, marginal, and poor stability or capability. This color coding scheme matches what you would see in the Process Performance graph.
Note: You can change the preferences for stability assessment type in File > Preferences > Platforms > Process Capability. This changes the stability assessment type used through the Process Capability platform.
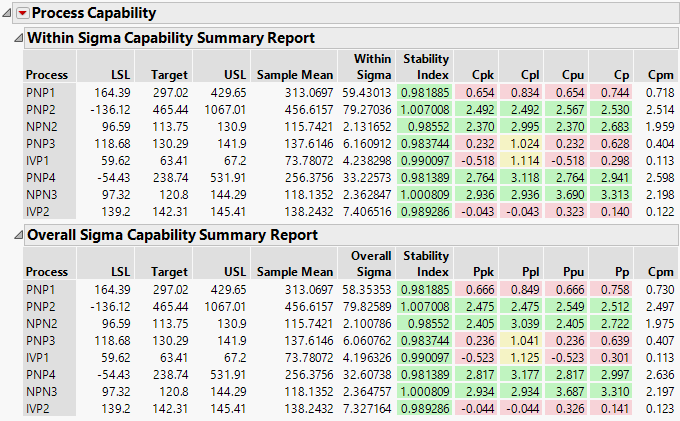
Figure 7.19 shows a subset of columns for both summary reports as described in Example of the Process Capability Platform with Normal Variables. The following optional columns are available for this report:
• Confidence intervals for Cpk, Cpl, Cpu, CP, and Cpm
• Expected and observed PPM statistics (outside, below LSL, above USL)
Note: The expected PPM statistics are the percentages you would expect to see based on the distribution chosen. By default, the distribution is normal. The observed PPM statistics are the percentages based on the actual data.
• Sample standard deviation
• The sample size (N), the minimum, and the maximum.
• Target Index
Note: Target Index is only available in the Within Sigma Capability Summary report.
To reveal these optional columns, right-click the report and select the column names from the Columns submenu.
Note that the report (based on overall sigma) shows the overall capability indices Ppk, Ppl, Ppu, and Pp instead of the within capability indices Cpk, Cpl, Cpu, and Cp. The labeling of the overall capability indices depends on the setting of the AIAG (Ppk) Labeling preference.
Figure 7.19 Within Sigma and Overall Sigma Capability Summary Reports
