Contingency Table
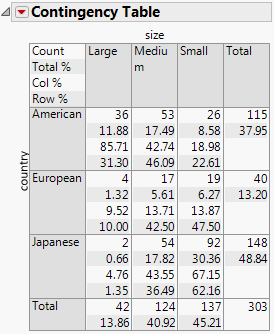
The Contingency Table is a two-way frequency table. There is a row for each factor level and a column for each response level.
To produce the plot shown in Figure 7.7, follow the instructions in Example of Contingency Analysis.
Figure 7.7 Example of a Contingency Table
Note the following about Contingency tables:
• The Count, Total%, Col%, and Row% correspond to the data within each cell that has row and column headings (such as the cell under American and Large).
• The last column contains the total counts for each row and percentages for each row.
• The bottom row contains total counts for each column and percentages for each column.
In Figure 7.7, focus on the cars that are large and come from America. The following table explains the conclusions that you can make about these cars using the Contingency Table.
Number | Description | Label in Table |
|---|---|---|
36 | Number of cars that are both large and come from America | Count |
11.88% | Percentage of all cars that are both large and come from America (36/303)1. | Total% |
85.71% | Percentage of large cars that come from America (36/42)2 | Col% |
31.30% | Percentage of American cars that are large (36/115)3. | Row% |
37.95% | Percentage of all cars that come from America (115/303). | (none) |
13.86% | Percentage of all cars that are large (42/303). | (none) |
1 303 is the total number of cars in the poll.
2 42 is the total number of large cars in the poll.
3 115 is the total number of American cars in the poll.
Tip: To show or hide data in the Contingency Table, from the red triangle menu next to Contingency Table, select the option that you want to show or hide.
