Example of the Fit Special Option
This example shows you how to add transformations to your data. Start by transforming Y as log and X as square root:
1. Select Help > Sample Data Library and open SAT.jmp.
2. Select Analyze > Fit Y by X.
3. Select 2004 Verbal and click Y, Response.
4. Select % Taking (2004) and click X, Factor.
5. Click OK.
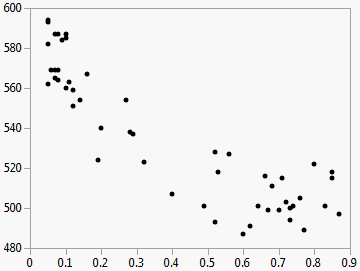
Figure 5.18 Example of SAT Scores by Percent Taking
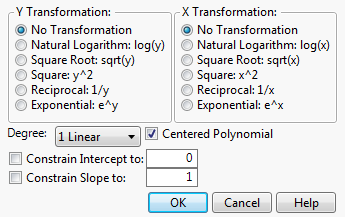
6. Click the Bivariate Fit red triangle and select Fit Special. The Specify Transformation or Constraint window appears. For a description of this window, see Fit Special.
Figure 5.19 The Specify Transformation or Constraint Window
7. Within Y Transformation, select Natural Logarithm: log(y).
8. Within X Transformation, select Square Root: sqrt(x).
9. Click OK.
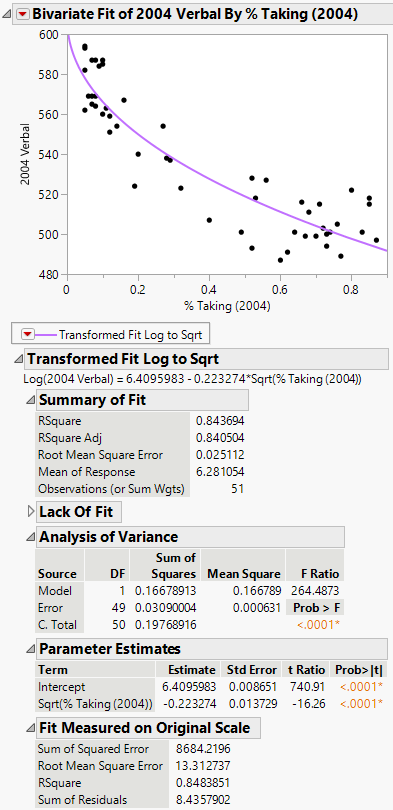
Figure 5.20 Example of Fit Special Report
Figure 5.20 shows the fitted line plotted on the original scale. The model appears to fit the data well, as the plotted line goes through the cloud of points.


