Launch the Multivariate Control Chart Platform
Launch the Multivariate Control Chart platform by selecting Analyze > Quality And Process > Control Chart > Multivariate Control Chart.
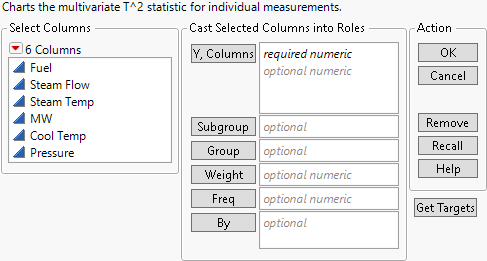
Figure 10.5 The Multivariate Control Chart Launch Window
For more information about the options in the Select Columns red triangle menu, see Column Filter Menu in Using JMP.
The Multivariate Control Chart platform launch window contains the following options:
Y, Columns
Specify the columns to be analyzed.
Subgroup
Enter a column with sub-grouped data. Hierarchically, this group is nested within Group.
Group
Enter a column that specifies group membership at the highest hierarchical level.
Weight
Identifies the data table column whose variables assign weight (such as importance or influence) to the data.
Freq
Identifies the data table column whose values assign a frequency to each row. Can be useful when your data table contains summarized data.
By
Identifies a column that creates a report consisting of separate analyses for each level of the variable.
Get Targets
Click to select a JMP table that contains historical targets for the process.
