Example of a Cell Plot
Learn how to create and analyze a cell plot in JMP. This example uses the Dogs.jmp sample data table, which contains histamine level measurements for 16 dogs that were given two different drugs. The histamine levels were taken at zero, one, three, and five minutes. Examine the variation in the histamine levels for each drug.
1. Select Help > Sample Data Library and open Dogs.jmp.
2. Select the third row from the bottom (row 14).
3. Select Graph > Cell Plot.
4. Select drug, hist0, hist1, hist3, and hist5 and click Y, Response.
5. Click OK.
The report window appears.
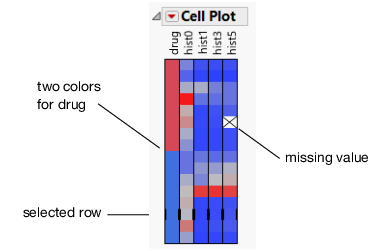
Figure 8.2 Dogs.jmp cell plot
Notice the following:
• There are two types of drugs, represented by two distinct colors.
• Histamine levels are assigned colors from a gradient of blue to red.
• Any missing values are delineated by an X.
• The third row from the bottom is selected, and black lines appear next to the cells.
