Example of Normal Mixtures Clustering
Cytometry is used to measure various characteristics of cells. Measurements of cell markers help diagnose certain diseases. In this example, you cluster observations based on readings of four markers in a cytometry analysis.
1. Select Help > Sample Data Library and open Cytometry.jmp
2. Select Analyze > Clustering > Normal Mixtures
3. Select CD3, CD8, CD4, and MCB and click Y, Columns.
4. Click OK.
5. Enter 6 next to Number of Clusters.
6. Click Go.
Note: Your results might differ because the algorithm has a random starting value.
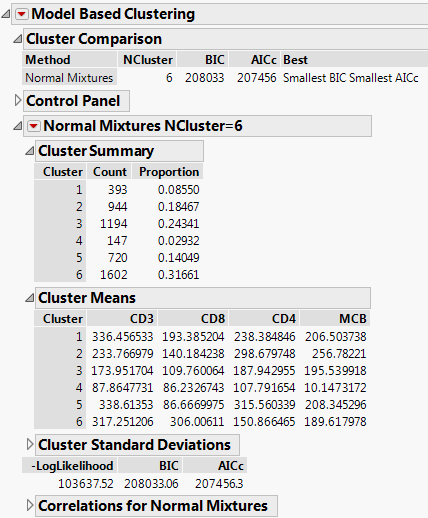
Figure 14.2 Normal Mixtures NCluster=6 Report
The Cluster Summary report shows the number of observations in each of the six clusters. The Cluster Means report shows the means of the four marker readings for each cluster.
7. Click the red triangle next to Normal Mixtures NCluster=6 and select Biplot 3D.
Note: Your biplot 3D might appear differently because the algorithm has a random starting value.
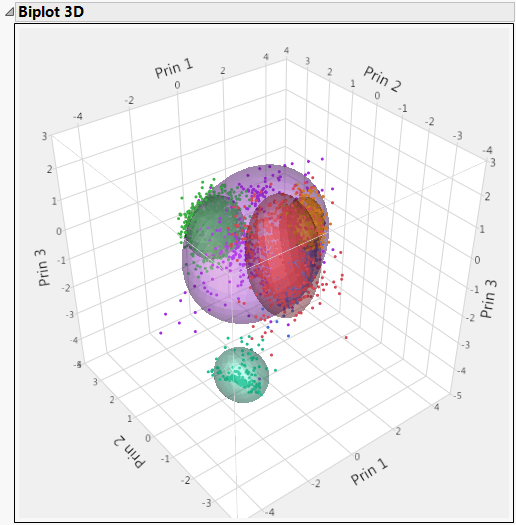
Figure 14.3 3D Biplot of Cytometry Data
The plot shows contours for the normal densities that are fit to the clusters. Note that one cluster appears to be distinctly separated from the other clusters based on the first three principal components.

