Nonparametric Test Statistics
This section provides formulas for the test statistics used in the Wilcoxon, Median, van der Waerden, and Friedman Rank tests.
Notation
The tests are based on scores and use the following notation.
j = 1,..., n
The observations in the entire sample.
i = 1,..., k
The levels of X, where k is the total number of levels.
n1, n2,..., nk
The number of observations in each of the k levels of X.
Rj
The midrank of the jth observation. The midrank is the observation’s rank if it is not tied and its average rank if it is tied.
α
A function of the midranks used to define scores for the various tests.
The following notation is used when a Block variable is specified in the launch window.
b = 1,..., B
The levels of the blocking variable, where B is the total number of blocks.
Rbi
The midrank of the ith level of X within block b.
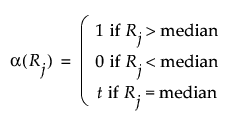
The function α defines scores as follows:
Wilcoxon Scores

Median Scores

Let nt denote the number of observations tied at the median and let nu denote the number of observations greater than the median. Then t is given by the following:

van der Waerden Scores

Friedman Rank Scores

Two-Sample Normal Approximations
Tests based on the normal approximation are given only when X has exactly two levels. The notation used in this section is defined in Notation. The statistics that appear in the Two-Sample Normal Approximation report are defined below.
S
The statistic S is the sum of the values α(Rj) for the observations in the smaller group. If the two levels of X have the same numbers of observations, then the value of S corresponds to the last level of X in the value ordering.
Z
The value of Z is defined as follows:

Note: The Wilcoxon test adds a continuity correction. If (S - E(S)) is greater than zero, then 0.5 is subtracted from the numerator. If (S - E(S)) is less than zero, then 0.5 is added to the numerator.
E(S)
The expected value of S under the null hypothesis. Denote the number of observations in the smaller level, or in the last level in the value ordering if the two groups have the same number of observations, by nl:

Var(S)
Define ave to be the average score across all observations. Then the variance of S is defined as follows:

Two-Sample Normal Approximations for Friedman Rank Test
When you use the Friedman Rank test, the calculations for the two-sample normal approximation is the same as above, except that the variance of S is different. The variance of S is computed as follows:

One-Way ChiSquare Approximations
Note: The ChiSquare test based on the Wilcoxon scores is known as the Kruskal-Wallis test.
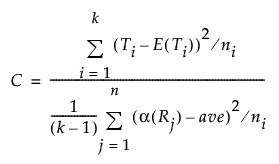
The notation used in this section is defined in Notation. The following quantities are used in calculating the ChiSquare statistic:
Ti
The total of the scores for the ith level of X.
E(Ti)
The expected value of the total score for level i under the null hypothesis of no difference in levels, defined as follows:

Var(T)
Define ave to be the average score across all observations. Then the variance of T is defined as follows:

The value of the test statistic is given below. This statistic is asymptotically ChiSquare on k - 1 degrees of freedom.

One-Way ChiSquare Approximations for Friedman Rank Test
The ChiSquare test statistic for the Friedman Rank Test is calculated as follows:
