Example of a C Chart
In this example, you use the C Control Chart launch window to launch Control Chart Builder. You want to explore data concerning the various defects discovered while manufacturing cabinets over two time periods.
1. Select Help > Sample Data Folder and open Quality Control/Cabinet Defects.jmp.
2. Select Analyze > Quality and Process > Control Chart > C Control Chart.
3. Select Type of Defect and click Y, n Defects.
4. Select Lot Number and click Subgroup.
5. Select Date and click Phase.
6. Click OK.
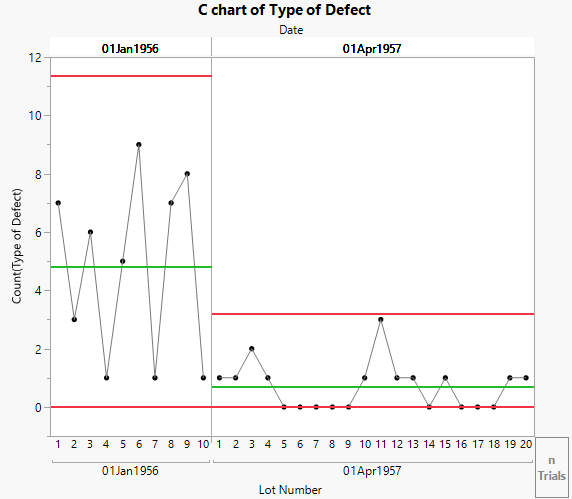
Figure 3.28 C chart of Type of Defect with Phases
You can now view the results on the two different days. Both appear to be within limits. You can also examine other defect type behavior using the Event Chooser.
7. Click the Control Chart Builder red triangle and select Show Control Panel.
8. Under Event Chooser, click the gray triangle next to Type of Defect.
The control chart is showing events that correspond to the Bruised veneer defect type.
9. Under Event Chooser > Type of Defect, click the box next to Bruised veneer.
10. Under Event Chooser > Type of Defect, click the box next to Defective Sanding.
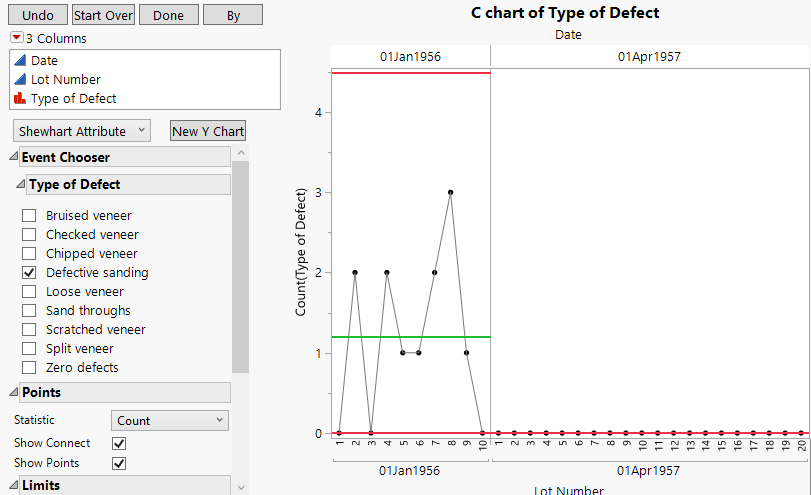
Figure 3.29 C Chart of Defective Sanding Defect Type
This chart shows that all of the events corresponding to the Defective sanding defect type occurred on the first day, 01Jan1956.

