Example of a Threshold for Combined Causes
This example uses a threshold value to combine causes with counts of 2 or fewer into one combined cause. The data table in this example lists causes of failure during the fabrication of integrated circuits and the number of times each type of defect occurred.
1. Select Help > Sample Data Folder and open Quality Control/Failure.jmp.
2. Select Analyze > Quality and Process > Pareto Plot.
3. Select failure and click Y, Cause.
4. Select N and click Freq.
5. Select Threshold of Combined Causes and then select Count.
6. Enter 2 as the threshold value.
7. Click OK.
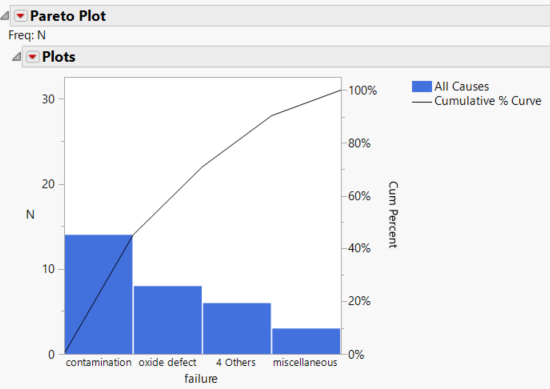
Figure 15.7 Pareto Plot with a Threshold Count of 2
Figure 15.7 displays the plot after specifying a count of 2. All causes with counts 2 or fewer are combined into the bar labeled 4 Others.
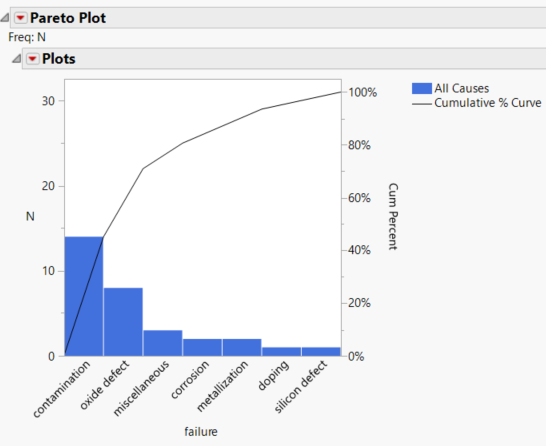
8. To separate the combined bars into original categories as shown in Figure 15.8, select the bar labeled 4 Others.
9. Click the Plots red triangle and select Selected Causes > Separate Causes.
Tip: Alternatively, you can right-click the bar labeled 4 Others and select Selected Causes > Separate Causes.
Figure 15.8 Pareto Plot with Separated Causes

