Example of Stacking Counts in Multiple Columns
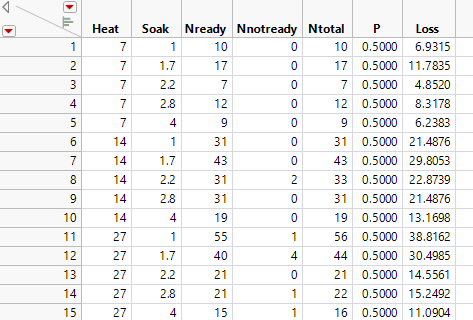
When data that are frequencies (counts) are listed in several columns of your data table, you must transform the data into the form that you need for logistic regression. For example, the Ingots2.jmp data table (Figure 12.12) has columns Nready and Nnotready. These columns give the number of ingots that are ready to roll and ingots that are not ready to roll for each combination of Heat and Soak values.
Figure 12.12 Ingots2.jmp Sample Data Table
Before fitting a logistic regression model, use the following steps to stack the Nready and Nnotready columns into a single column:
1. Select Help > Sample Data Folder and open Ingots2.jmp.
2. Select Tables > Stack.
3. Select Nready and NNotReady from the Select Columns list and click Stack Columns.
4. Click OK.
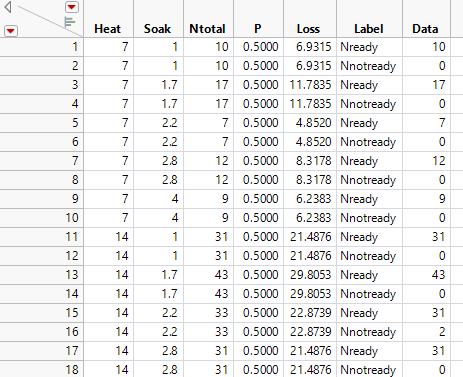
This creates the new table in Figure 12.13. Label is the response (Y) column and Data is the frequency column.
This stacked data table is equivalent to the Ingots.jmp sample data table used in Example of Nominal Logistic Regression.
Figure 12.13 Stacked Data Table

