Launch the Multidimensional Scaling Platform
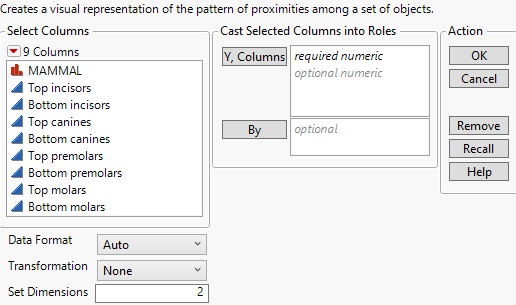
Launch the Multidimensional Scaling platform by selecting Analyze > Multivariate Methods > Multidimensional Scaling.
Figure 10.4 Multidimensional Scaling Launch Window
For more information about the options in the Select Columns red triangle menu, see Column Filter Menu in Using JMP.
Y, Columns
The columns to be analyzed. These must have a Numeric data type.
By
A column or columns whose levels define separate analyses. For each level of the specified column, the corresponding rows are analyzed using the other variables that you have specified. The results are presented in separate reports. If more than one By variable is assigned, a separate report is produced for each possible combination of the levels of the By variables.
Note: When using a distance matrix, the By variable requires a full matrix for each level of the By variable.
Data Format
MDS supports two data formats. You can specify a format or allow JMP to infer the data format.
Auto
The data format is inferred. Heuristics are used to identify a table that is a distance matrix and all other data tables are assumed to have the attribute list format.
Distance Matrix
A full symmetric, lower, or upper triangular matrix where the number of rows equals the number of columns.The diagonal entries can either be zeros or missing.
Attribute List
A set of columns that contain measures of a quality or characteristic of an object. It is assumed that the measures are on the same scale. The objects are typically named in a column. The object column is not used in the analysis but rather is used as a label for the data points on the MDS plot.
Transformation
Supported transformations are Ratio, Interval, and Ordinal.
None
No transformation used.
Ratio
Data has an ordering from smallest to largest, the differences between values have meaning, and the scale has a true zero. Used to scale the MDS plot.
Interval
Data has an ordering from smallest to largest and the differences between values have meaning. Used to scale and shift the MDS plot.
Ordinal
Data has an ordering from smallest to largest. Used for ordinal data.
Set Dimensions
The number of dimensions for the visual representation of the proximities among your objects. Typically, two or three dimensions are used. With greater than three dimensions, the visualization becomes complex.
Note: The dimension selected can be between 1 to n - 1 where n = the number of objects, otherwise the dimension is set to 2.
Processing a distance matrix and the multiple dimensional scaling optimization are computationally intensive processes. When processing a large distance matrix, a progress window enables you to monitor or cancel the process. For optimization, MDS uses a nonconvex optimization algorithm. It is important to use multiple starting values to avoid a solution that is a local optima. For moderate to large data sets, an interactive progress window allows you monitor the optimization progress, to accept the estimates for the current start, or to accept the current solution.
