JMP Live for SPC
Statistical Process Control (SPC) methods help you monitor and control processes so that you can resolve issues and improve quality. Starting in JMP Live version 19, you can triage control chart warnings and interact with process screening control charts.
Tip: To learn about control charts and process screening in JMP, see Quality and Process Methods in the JMP Help.
Learn how:
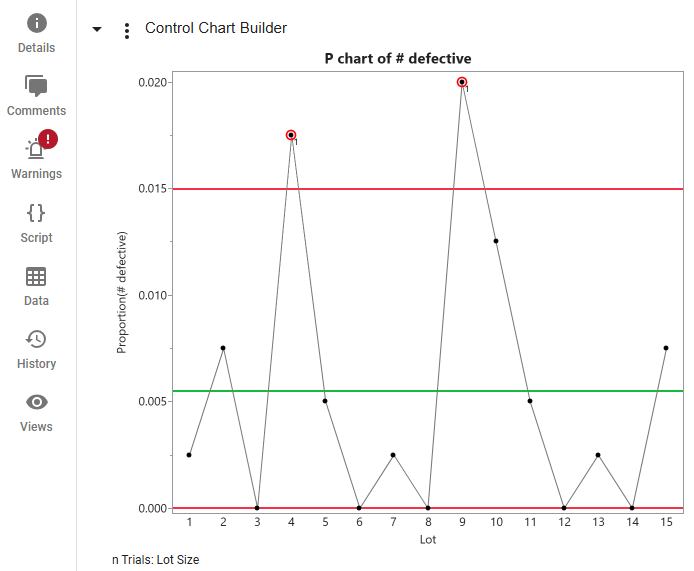
Figure 1.1 Example Showing Control Chart Warnings in JMP Live
Control Chart Triage in JMP Live
Starting in JMP Live 19, with control chart triage, you can:
|
•
|
Determine which processes are truly out of control and require immediate attention
|
|
•
|
Signal when the root cause of instability is under investigation
|
|
•
|
Notify others when the root cause has been addressed and the process is stable and performing as expected
|
|
•
|
Focus your team’s resources on the most critical issues, resulting in more effective problem solving and process improvement
|
Important:
Control chart triage supports only static limits, not dynamically calculated limits. Dynamic control chart limits could result in unstable warning lists that change as data is added or changed. To see an example of adding static control chart limits (as column properties), see Set Static Control Limits. For additional ways to add static control chart limits, see “Example of Control Limits” in the JMP Help.
Example of Triaging Control Chart Warnings
In this example, an engineer has data relating to the production of steel washers. They want to identify and triage the proportion of washers in each lot that are defective, based on static control chart limits. Follow these steps:
Set Static Control Limits
|
1.
|
In JMP, select Help > Sample Data Folder and open Quality Control/Washers.jmp.
|
|
2.
|
Right-click the # defective column and select Column Properties > Control Limits.
|
|
3.
|
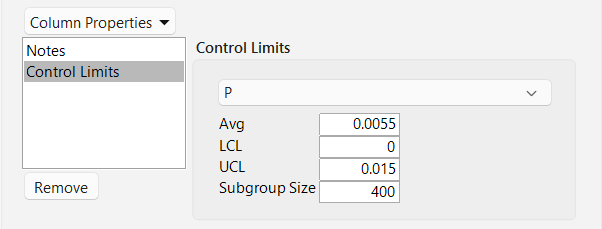
Change XBar to P.
|
|
4.
|
For Avg, enter 0.0055.
|
|
5.
|
For LCL, enter 0.
|
|
6.
|
For UCL, enter 0.015.
|
|
7.
|
For Subgroup Size, enter 400.
|
Figure 1.2 Control Limits in JMP
|
8.
|
Click OK.
|
Create a Control Chart
|
1.
|
In JMP, select Analyze > Quality and Process > Control Chart > P Control Chart.
|
|
2.
|
Select # defective and click Y, n Defective.
|
|
3.
|
Select Lot and click Subgroup.
|
|
4.
|
Select Lot Size and click n Trials.
|
|
5.
|
Click OK.
|
|
6.
|
Click the red triangle next to Control Chart Builder and select Show Control Panel.
|
|
7.
|
Open Warnings > Tests and click Test 1.
|
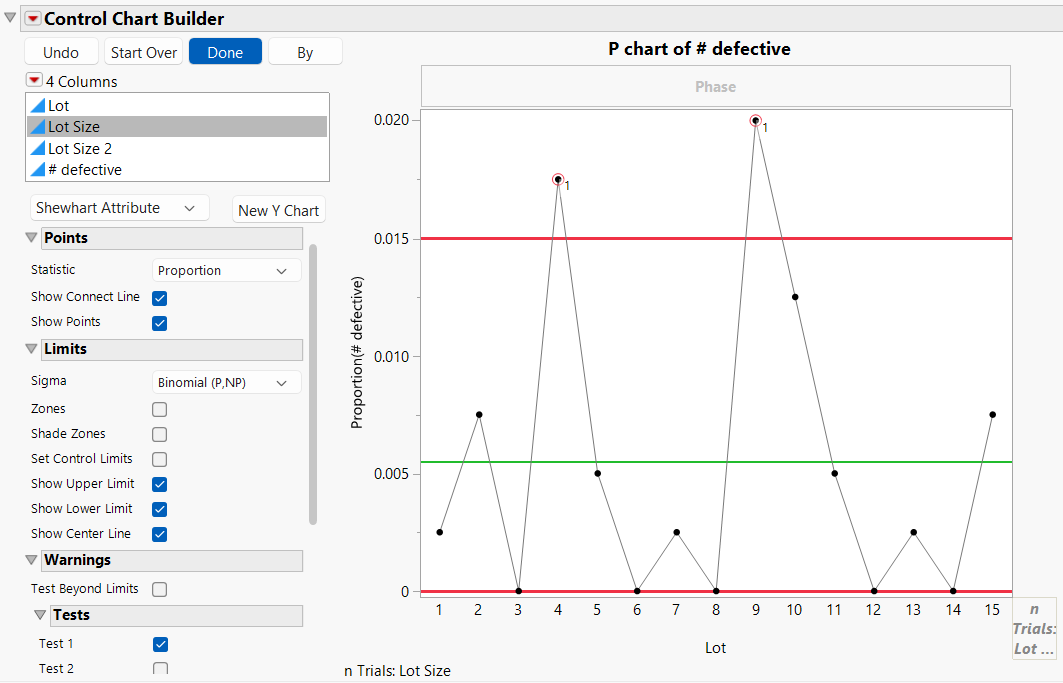
Figure 1.3 Control Chart in JMP
|
8.
|
Click Done.
|
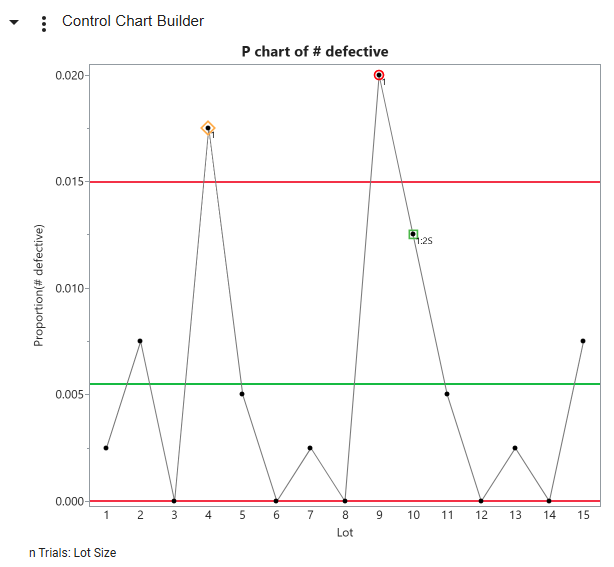
The P-chart shows the proportion of defective washers per lot. You can see that there are two points beyond the control chart limits.
Publish a Control Chart
|
1.
|
In JMP, with the control chart report open, select File > Publish > Publish Reports to JMP Live.
|
|
2.
|
Follow the steps in the wizard to publish the report, and then open the report in JMP Live.
|
Figure 1.4 Control Chart Post in JMP Live
The control chart warnings are circled in red in the graph, and the Warnings icon appears at left with a red exclamation mark.
Click a warning in the control chart to open the Warnings panel. You can do any of the following actions:
|
•
|
See warning information. Click the rows link to open the data table with the impacted rows highlighted.
|
|
•
|
See which tests failed.
|
|
•
|
Triage the warning, add notes, and see triage history.
|
Share a Control Chart
In a JMP Live control chart post, click  > Copy link. You can paste this link in a text or email.
> Copy link. You can paste this link in a text or email.Assign Warnings for Triage
|
1.
|
Open a control chart post in JMP Live.
|
|
2.
|
Click a warning in the control chart.
|
The Warnings panel opens with the details for that warning. See Figure 1.5.
Tip: To assign multiple warnings to a single person or group, drag a box around the warnings in the control chart, and then right-click and select Triage.
|
3.
|
Click
 next to Assignee to assign the warning to a person or group who has access to the post. Or, click Assign to me. next to Assignee to assign the warning to a person or group who has access to the post. Or, click Assign to me. |
|
4.
|
(Optional) Enter any relevant notes about the warning for the assignee.
|
|
–
|
You can @mention someone in the notes and they get a notification.
|
|
–
|
You can use markdown syntax for formatting, such as * text for bullets, 1. text for numbered lists, *italics*, and **bold**.
|
|
5.
|
Click Save.
|
Figure 1.5 Assigning a Warning in JMP Live
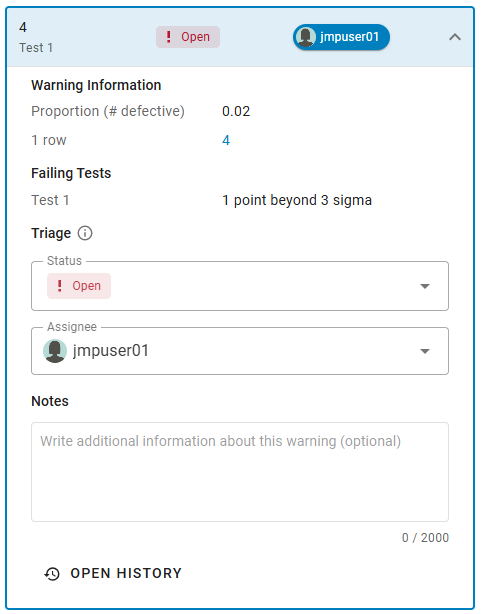
The assignee gets notifications in JMP Live and by email. For details about notifications, see Manage Warning Notifications.
Triage Warnings
|
1.
|
Open the control chart post in JMP Live.
|
|
2.
|
Click a warning in the control chart.
|
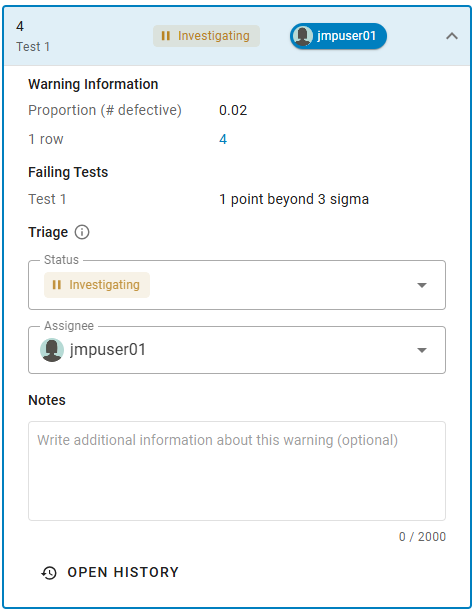
The Warnings panel opens with the details for that warning.
Tip: To triage multiple warnings at once, drag a box around the warnings in the control chart, and then right-click and select Triage. Using this method, all selected warnings have the same status after triaging.
|
3.
|
Change the status to Investigating or Addressed.
|
|
4.
|
(Optional) Enter any relevant notes about the investigation or fix.
|
|
5.
|
Click Save.
|
Figure 1.6 Triaging a Warning in JMP Live
Review Triaged Warnings
|
1.
|
Open the control chart post in JMP Live.
|
|
2.
|
Click Warnings.
|
|
3.
|
Click
 to see the details for a warning. to see the details for a warning. |
|
4.
|
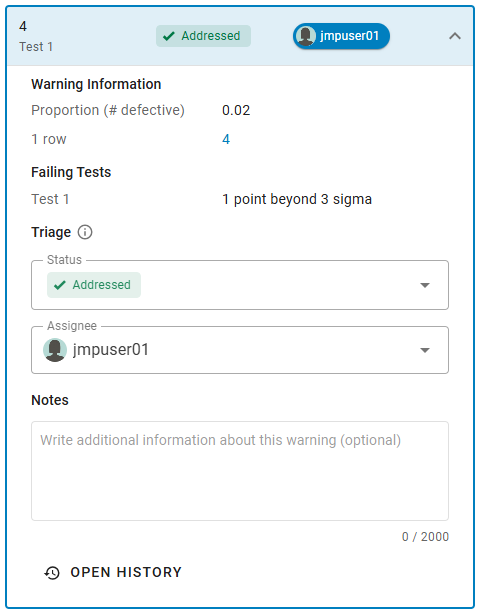
Verify that the warning is Addressed and review any notes.
|
Figure 1.7 Verifying an Addressed Warning in JMP Live
|
5.
|
(Optional) Click OPEN HISTORY to see or download the triage history for the warning.
|
Get Triage Information
In a control chart, you can:
|
•
|
Hover over a warning to see details
|
|
•
|
Click a warning to open its details in the Warnings panel
|
Triage Statuses
Open (red circle)
The warning has not been addressed yet and needs attention.
Investigating (yellow diamond)
The warning is under investigation.
Addressed (green square)
The warning has been addressed.
Figure 1.8 Triage Statuses in a Control Chart
Tip: To show the triage legend, from a post, click  > Advanced > Show triage status legend.
> Advanced > Show triage status legend.Control Chart Icons
Asterisk (*)
The marker is beyond the limits (Test Beyond Limits).
1-8
The marker failed Shewhart tests 1-8.
1:2S
The marker failed Westgard Rules, which use abbreviations to denote specific rule failures. This example indicates the first rule failed, one point beyond 2 sigma.
Manage Warning Notifications
If you enable control chart warning notifications, you get an email about the warnings on posts that you subscribe to. When all of the warnings in a post are triaged (moved out of the Open status) no further notifications are sent.
Subscribe to warnings
|
1.
|
In a space, folder, or post that contains control charts, click
> Subscriptions. |
|
2.
|
Click to subscribe to control chart warnings on all posts in a space, folder, or on an individual post.
|
Enable or disable warning notifications
|
1.
|
In JMP Live, click Notifications
 > >  . . |
There are two notification settings for control charts:
|
–
|
Assigned a control chart warning
|
|
–
|
Control chart warnings (for posts that you are subscribed to)
|
|
2.
|
Enable or disable these notifications.
|
|
3.
|
For enabled notifications, choose how often you want to be notified by email.
|
For more details, see “Control Chart Warnings in Graphs” and “Manage Notifications” in the JMP Live help.
Invalidated and Reset Warnings
After you publish a control chart to JMP Live, if any of these changes occur:
|
•
|
The control limits change
|
|
•
|
Which control chart tests are executed changes
|
|
•
|
The original data values change or are deleted (appending new data does not invalidate or reset warnings)
|
Your control chart warnings might change or disappear from the control chart, becoming invalidated.
|
•
|
When a warning is invalidated, that warning and any closely related warnings that occurred later are reset so that you can re-examine them. However, you can find or download invalidated warnings in JMP Live. See Search for Warnings or Download Warnings.
|
|
•
|
When a warning is reset, the triage status returns to Open and the assignee and notes are removed. However, you can see previous triage decisions in a warning’s history. Refer to Process Screening in JMP Live.
|
Note: If you filter data or exclude or hide points in a post, it can impact warnings and cause the post to be out of sync. (These changes occur only in your view of the data, so no one else sees them.) In these cases, triaging is disabled for you and a warning message appears. If you refresh the page or select Reset on the warning message, the post goes back to its original, published state and you can resume triaging.
Search for Warnings
Search for all warnings
|
1.
|
Open the Home page.
|
|
2.
|
Click Overview.
|
Under Control Chart Warnings, you can see recently updated posts that contain warnings in spaces and folders that you have permission to access.
|
3.
|
(Optional) Click View all to see all posts containing warnings.
|
Search for warnings assigned to you
|
1.
|
Open the Home page.
|
|
2.
|
Click Warnings List.
|
|
3.
|
(Optional) Change the status or assignee filters.
|
Tip: To see unassigned warnings, change the assignee to Unassigned.
Search for warnings in a space
|
1.
|
Open a space.
|
|
2.
|
Click Warnings.
|
Search for warnings in a folder
|
1.
|
Open a folder.
|
|
2.
|
Click
 at the upper right. at the upper right. |
|
3.
|
Select the Control Chart status that you want to filter by. You can also click Warnings assigned to me.
|
Search for warnings in a post
|
1.
|
Open a post with warnings.
|
|
2.
|
Click Warnings.
|
|
3.
|
Click
. |
|
4.
|
Select the options to filter by.
|
See Warning History
To see the history of a warning in a post, open the warning and click OPEN HISTORY.
To see the history for warnings in a space, open the space and click History. You can filter by the action of warnings created or updated.
JMP Live administrators can access more historical details for warnings at Admin > Log.
Download Warnings
For data that you have download access to, you can download the current state or the history of the warnings as a .csv file.
Download all warnings for a post
|
1.
|
Open a post with warnings.
|
|
2.
|
Click Warnings.
|
|
3.
|
Click
 . . |
|
4.
|
Choose whether to download the current state or the history of all warnings for the post.
|
|
5.
|
(Optional) Change the filter for which warnings to download.
|
|
6.
|
Click Download.
|
Download the warning history for a single warning
|
1.
|
Open a post with warnings.
|
|
2.
|
Click Warnings.
|
|
3.
|
Click
to see the details for a warning. |
|
4.
|
Click OPEN HISTORY to see or download the triage history for the warning.
|
Process Screening in JMP Live
Starting in JMP Live 19, you can publish interactive Process Screening reports, making it easy to monitor many processes at once and to interactively select specific processes for further analysis or investigation.
Example of Interactive Process Screening
In this example, you are interested in identifying unstable processes in a data table that contains process measurements. Each column contains a Spec Limits column property. If a process is stable, it is appropriate to calculate its process capability.
|
1.
|
Select Help > Sample Data Folder and open Semiconductor Capability.jmp.
|
|
2.
|
Select Cols > Columns Manager.
|
|
3.
|
Click in the Filter box and enter IVP.
|
|
4.
|
Select the gray triangle next to Processes to see the results. Select all of the IVP processes and then close the report.
|
|
5.
|
In the data table, select Analyze > Quality and Process > Process Screening.
|
|
6.
|
Click Process Variables. This assigns the 10 columns that you selected as the process variables.
|
Notice that the Control Chart Type is set to Indiv and MR (Individual and Moving Range charts).
|
7.
|
Click OK.
|
Figure 1.9 Process Screening Summary Report in JMP
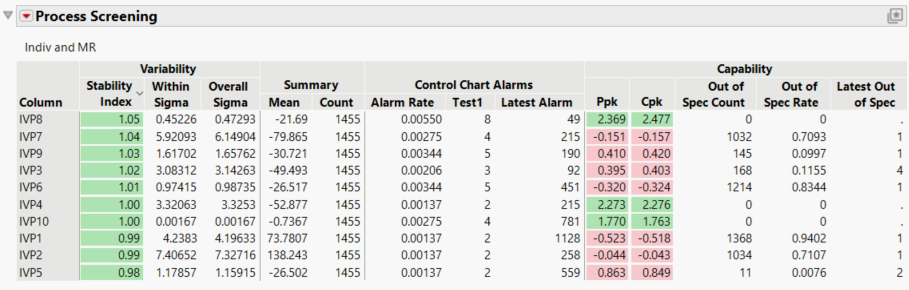
This report contains a table of results for each process. The results are sorted by the stability index, which measures the stability of a process. A stable process has a stability index near 1. Higher values indicate a less stable process. (The sorting is indicated by the caret next to Stability Index.)
|
8.
|
To take a closer look at less stable processes, click IVP8, IVP7, and IVP9. Right-click the highlighted rows and select Show Charts for Selected.
|
|
9.
|
Click the Process Screening red triangle and select the following:
|
|
–
|
Alarm Graph
|
|
–
|
Goal Plot
|
Note: Additional charts appear in tabs when you publish the report to JMP Live.
|
10.
|
Select File > Publish > Publish Reports to JMP Live.
|
Note: A JMP Live server connection must be set up and you might need to sign in to JMP Live. See “Add a Connection to a JMP Live Server” in the JMP Help.
|
11.
|
Follow the steps in the wizard to publish the report, and then open the report in JMP Live.
|
Figure 1.10 Process Summary Post in JMP Live
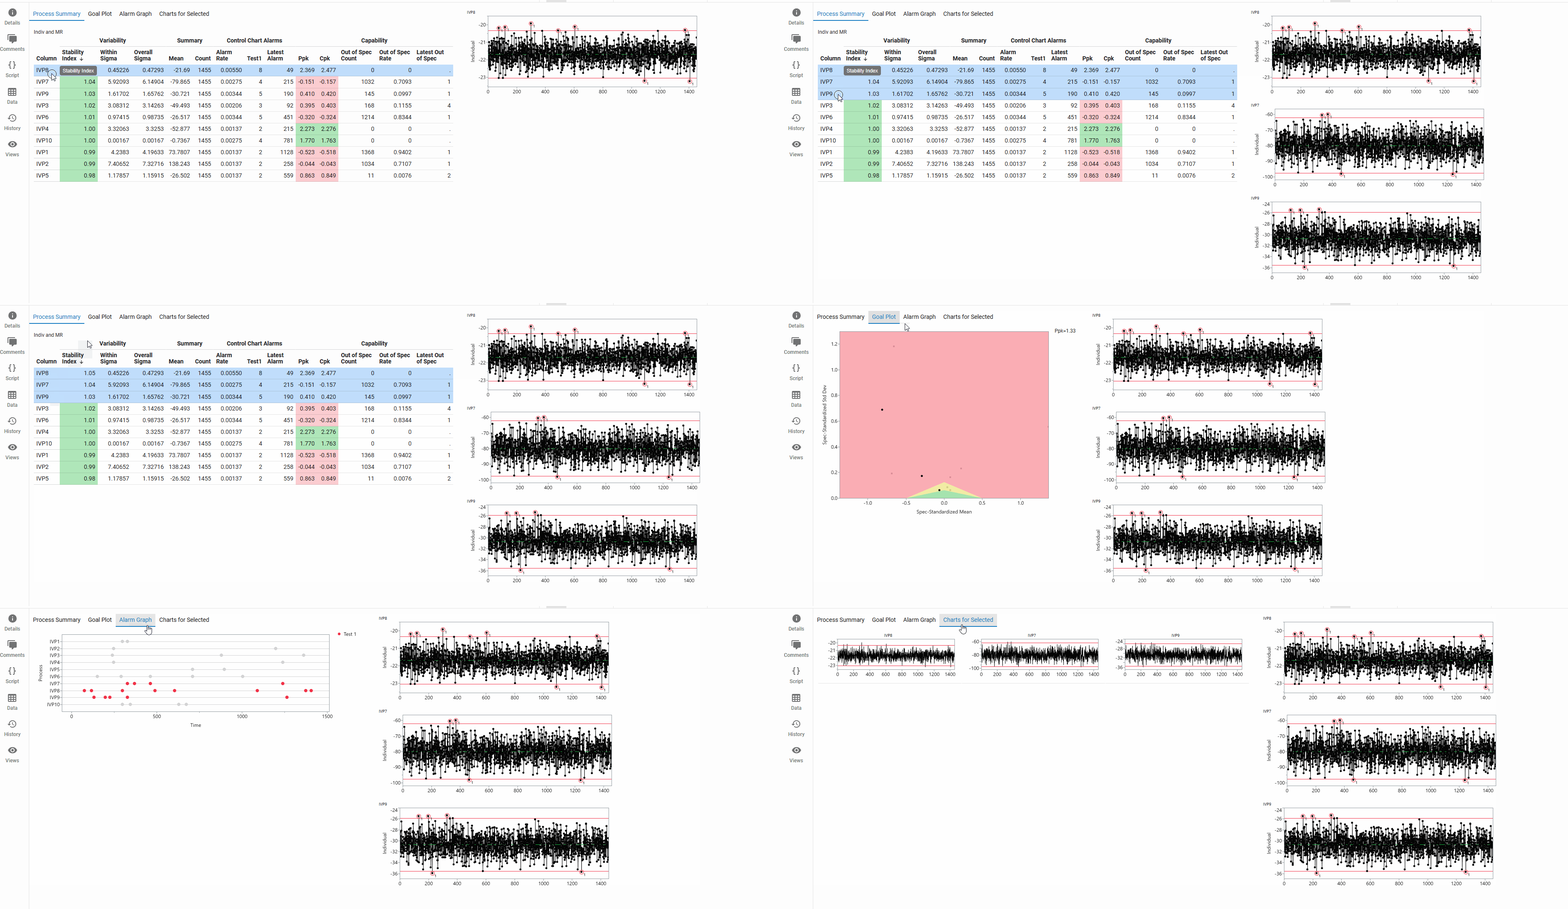
Note the following about this post:
|
•
|
Additional charts (in this example, Goal Plot, Alarm Graph, and Charts for Selected) appear in tabs. The Charts for Selected tab contains charts for the rows that you selected in JMP prior to publishing to JMP Live.
|
|
•
|
Click columns in tables or points in graphs to show their individual control charts at right.
|
Example of Environmental Monitoring
In this example, a pharmaceutical manufacturer monitors their sites for possible contaminants from the environment. Several monitoring devices report on these contaminants many times a day. Use the Process Screening platform to process the data in a meaningful way and share the report in JMP Live.
|
1.
|
In JMP, select Help > Sample Data Folder and open Quality Control/Environmental Monitor Sim.jmp.
|
|
2.
|
Select Analyze > Quality and Process > Process Screening.
|
|
3.
|
Select Count and click Process Variables.
|
|
4.
|
Select Type, Grade, and Site and click Grouping.
|
|
5.
|
Select Time and click Time.
|
|
6.
|
Set the Control Chart Type to Count.
|
Figure 1.11 Process Screening Launch Window in JMP
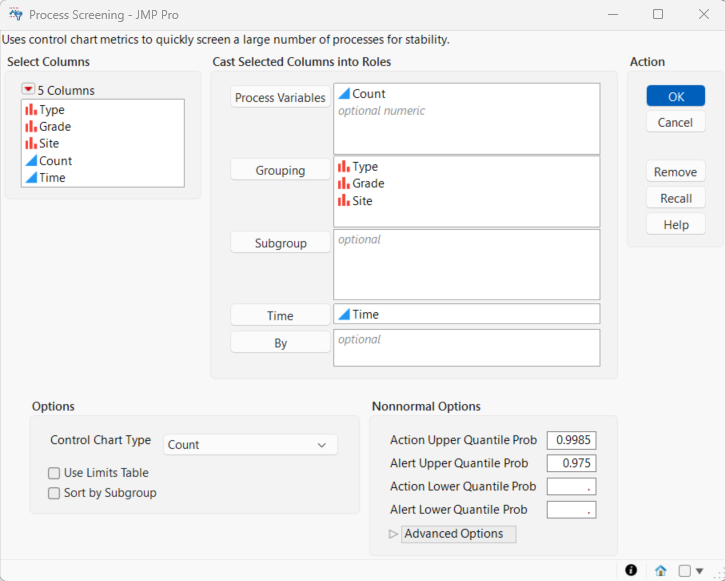
|
7.
|
Click OK.
|
|
8.
|
In the Summary table, select the fourth row with the type Viable.
|
|
9.
|
Click the Process Screening red triangle and select the following:
|
|
–
|
Show Charts for Selected
|
|
–
|
Alarm Graph
|
|
10.
|
Click the Charts for Selected red triangle and select the following:
|
|
–
|
Show Markers
|
|
–
|
Show Zones
|
|
–
|
Circle Alarm Points
|
Figure 1.12 Process Screening Report in JMP
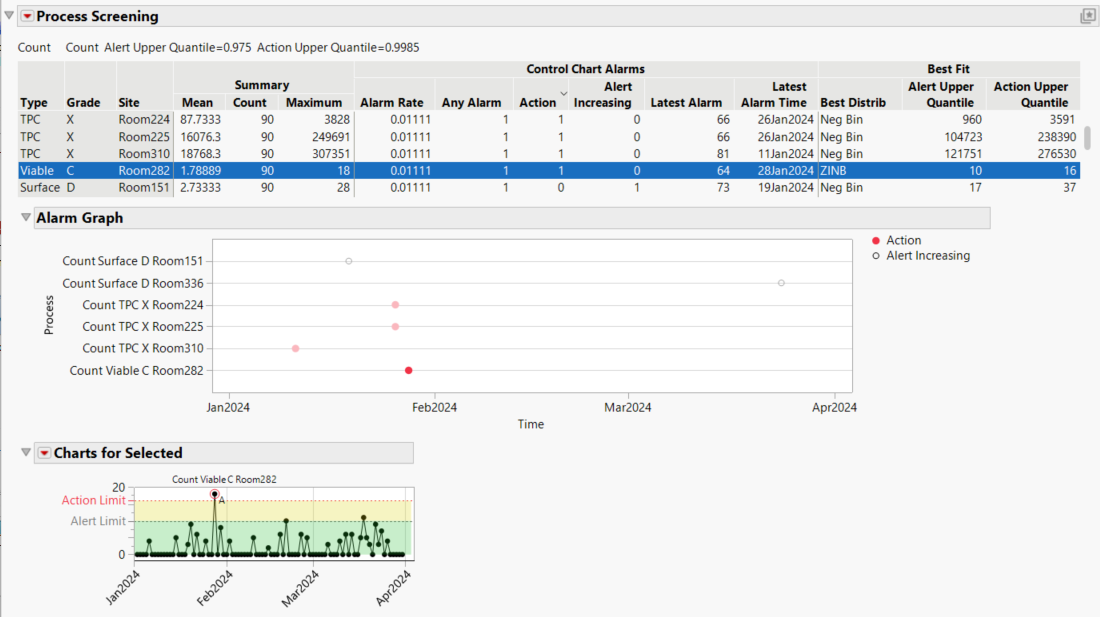
The Summary table (shown partially) sorts each process by the Action count.
Tip: To resize the Summary table, click and drag from the bottom of the table.
For the process that you selected:
|
•
|
There was an action alarm in late January 2024. The action limit (Action Upper Quantile) was set to 16, which is the 99.85% quantile of the fitted distribution.
|
|
•
|
The alarm graph shows six processes with alarms by date, including two that are near the same time as the selected process. This could be an indication of possible cross-contamination between monitoring sites.
|
|
11.
|
Select File > Publish > Publish Reports to JMP Live.
|
Note: A JMP Live server connection must be set up and you might need to sign in to JMP Live. See “Add a Connection to a JMP Live Server” in the JMP Help.
|
12.
|
Follow the steps in the wizard to publish the report, and then open the report in JMP Live.
|
|
13.
|
In the Summary table, select the 4th row with the type Viable.
|
Figure 1.13 Process Summary Post in JMP Live
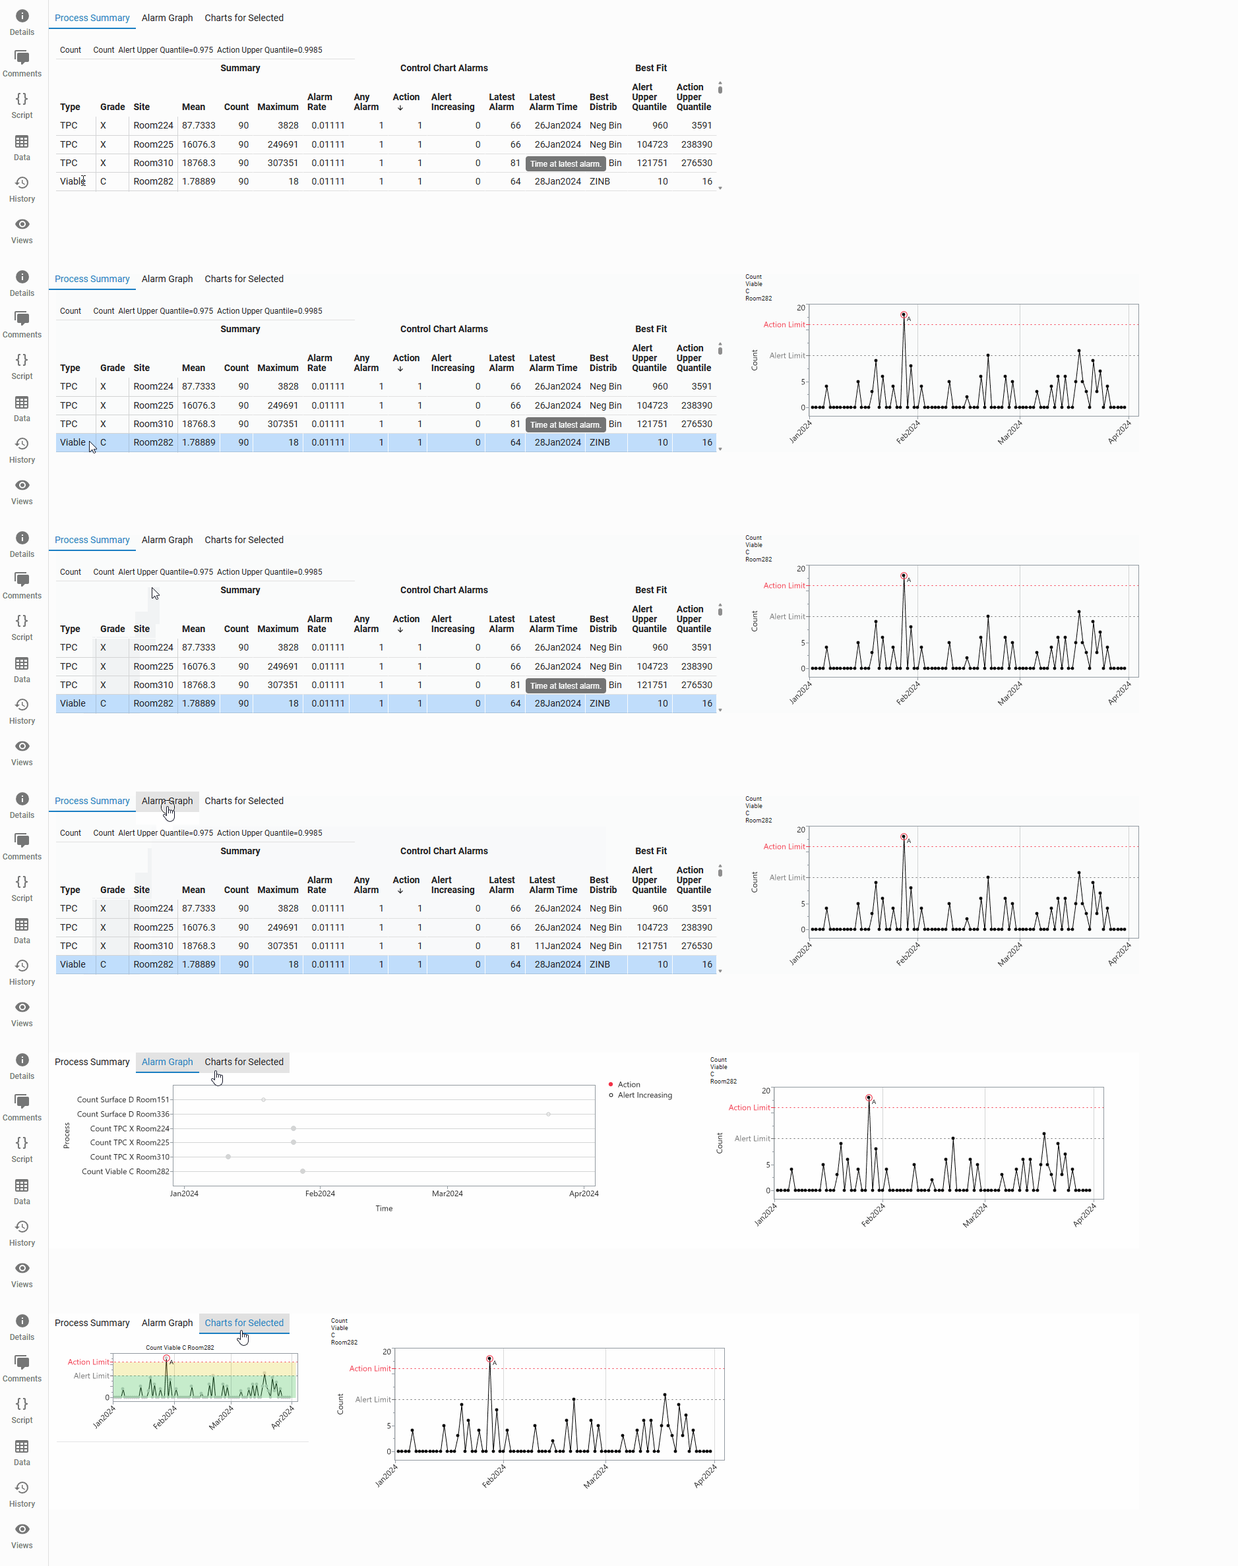
Note the following about this post:
|
•
|
Additional charts (in this example, Alarm Graph, and Charts for Selected) appear in tabs. The Charts for Selected tab contains charts for the rows that you selected in JMP prior to publishing to JMP Live.
|
|
•
|
Click columns in tables or points in graphs to show their individual control charts at right.
|