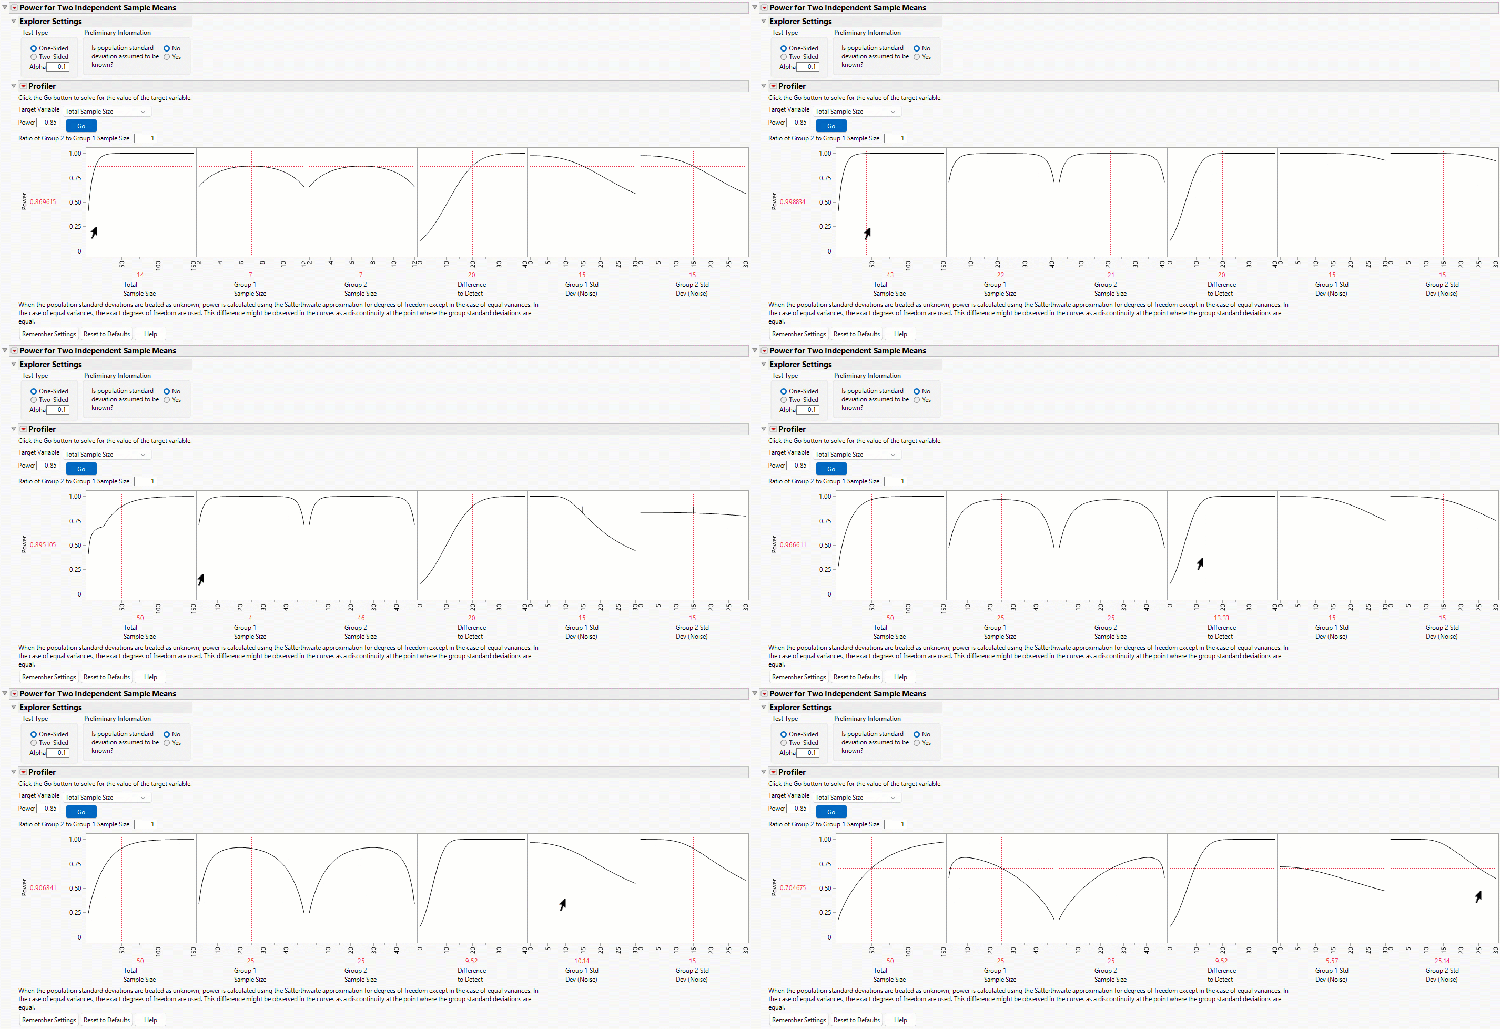
Power Analysis
What is power analysis?
Power analysis helps you plan a study, experiment, or test before you collect data. It tells you the right sample size for your study to be able to detect the effects that matter to you. You can compare this analysis with your budget to decide if it is worth it to run the study.
Why should you use power analysis?
Power analysis is used to decide how much data you need to collect to meet your study goals. A study with too few observations might miss an important effect. A study with too many observations can waste time, money, and resources. Power analysis helps you find a reasonable balance.
Power analysis is commonly used to:
- Determine how many observations (samples, runs, parts, patients, or batches, for example) are needed for a given effect size, significance level, variability of the response, and power.
- Compare alternative study or experimental designs.
- Understand the relationship among power, sample size, variability, significance level, and effect size.
Decide whether a proposed study is likely to be informative before investing in it.
What information do you need to perform a power analysis?
A power analysis usually depends on five quantities: the size of the effect you want to detect, the natural variability in the response, the significance level for the test, the power of the test, and the sample size or number of experimental runs. If four of these quantities are known or assumed, the last one can be calculated.
For instance, you might ask how much smaller an effect you could detect if you added 10 more observations, while keeping the same power, significance level, and variability. Or you might examine how power changes when the sample size, effect size, and variability stay fixed, but you are willing to use a larger significance level.
How do you interpret power?
Power is the probability that a statistical test will detect an effect of a certain size when that effect is truly present. Detecting an effect is rejecting the null hypothesis and deciding in favor of the alternative hypothesis. For example, a power of 0.80 means that, under the assumptions used in the calculation, the study has an 80% chance of detecting the specified effect. It means that if you could run the entire study many times, in 80% of those studies, the effect will have a p-value less than the significance level, and in 20%, the effect will have a p-value greater than the significance level.
The calculated power depends on assumptions about the effect size, variability, model, and test. If those assumptions are unrealistic, the calculated power can be misleading. For that reason, it is often useful to explore several scenarios rather than rely on a single number.
Example of a power analysis
Suppose a team is comparing two manufacturing settings and wants to know whether the new setting improves the average response by an amount that would be practically meaningful. If the new setting does not improve the response by this effect size, the process should not be changed. Before running the study, the team estimates the expected variability in the response and chooses a significance level. A power analysis can then estimate how many runs are needed to have a specified chance of detecting the improvement if it is real.
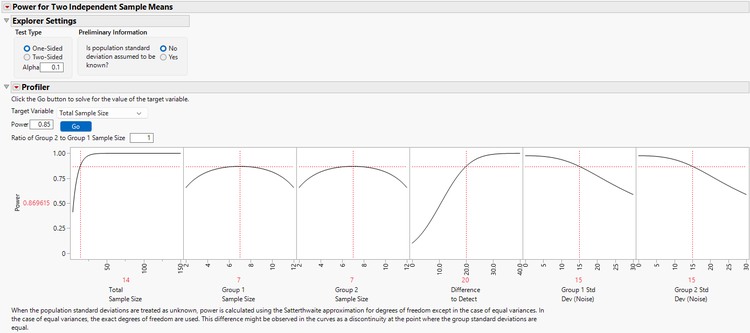
In the figure below, you can see the results of a power analysis. The team decided to run a two-sample t-test at an $\alpha$ = 10% level of significance. They need at least 85% power to detect a change from 40 to 60, and the standard deviation of the response in each group is expected to be 15. The required sample size is 14 total batches, seven for each manufacturing setting.
In the animation below, you can see how specifying the significance level, power, difference to detect, and noise variation can give required sample size.
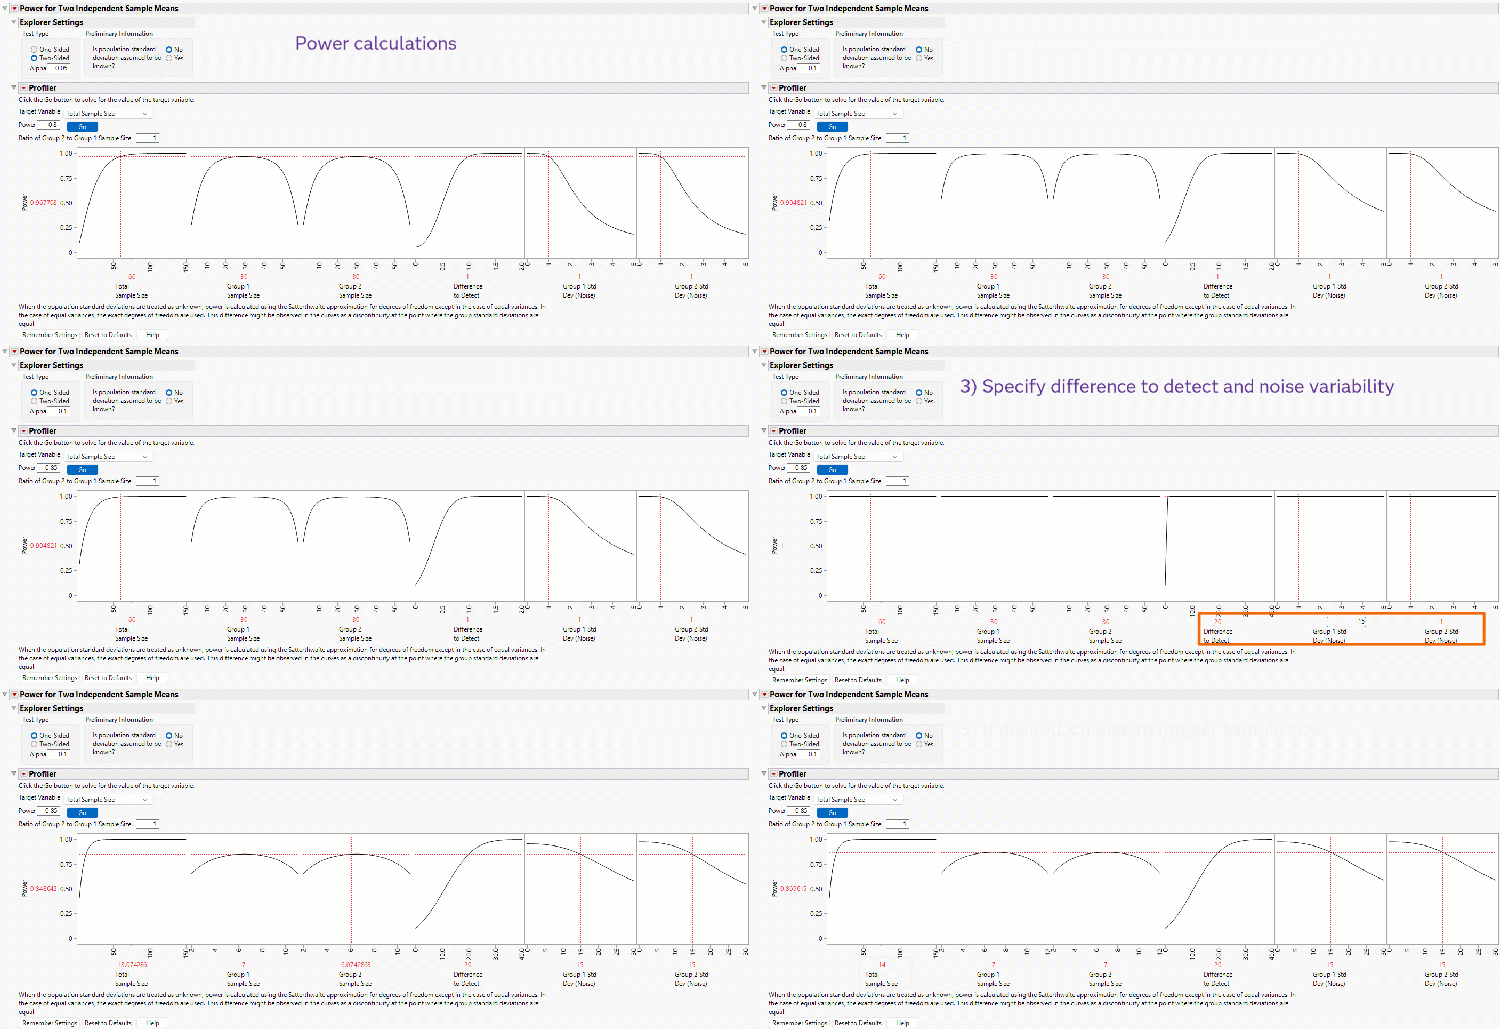
In the animation below, you can see that:
- Reducing total sample size reduces power. Increasing total sample size increases power.
- Imbalance in the sample size between the groups reduces power.
- Reducing the difference to detect reduces power. Increasing the difference to detect increases power.
- Decreasing noise variation increases power. Increasing noise variation decreases power.