P-values
What is a p-value?
A p-value is a probability used in hypothesis testing. You make a statistical hypothesis, collect data to support your claim, then calculate a p-value to make a decision. A p-value is the probability, if the null hypothesis is actually true, of getting the evidence you did (or even more evidence) in favor of the alternative hypothesis. It is the probability of seeing your result by chance alone. A smaller p-value indicates higher evidence for the alternative hypothesis. Interpretation of a p-value requires reliance on strict assumptions.
What is p-hacking?
The practice of repeatedly trying different analyses, models, variables, subgroups, transformations, or data-cleaning choices until a statistically significant p-value is found is known as p-hacking, data fishing, or cherry picking. Researchers might not set out to mislead, but each extra decision gives the data another chance to produce a small p-value by random variation alone. It is known as the multiple comparisons problem. The result can make weak or accidental patterns look like strong evidence against the null hypothesis. To avoid p-hacking, researchers should define hypotheses and analysis plans before looking at the data, report all analyses that were tried, and interpret p-values in the context of study design, assumptions, and practical significance.
The American Statistical Association statement onp-values has more information on the proper use of p-values in null hypothesis testing.
Why do we use p-values?
We use p-values to help us compare what we observed in a sample to what we would expect if the null hypothesis were true in the population. They provide a standard way to measure how surprising the data are under a specific statistical model. In practice, p-values are used as part of a decision-making process, such as deciding whether there is enough evidence of an effect to support the decision to change a process. They are most useful when their hypothesis tests are planned before the analysis and interpreted together with the study design, data quality, assumptions, and the size of the observed effect.
How do you interpret a p-value?
A small p-value means the observed data would be unusual if the null hypothesis were true. A small p-value can be evidence against the null hypothesis, but it is not proof that the alternative hypothesis is true. A large p-value means the data do not provide strong evidence against the null hypothesis, but it does not prove that the null hypothesis is true. The interpretation always depends on the question being asked, the assumptions of the analysis, and how the data were collected. The value used to decide when a p-value is small enough is called the level of significance. You reject the null hypothesis if the p-value is less than the significance level $\alpha$, that is, reject H0 if p < $\alpha$.
Let’s look at an example. Suppose you are performing a one-sided two-samplet-test to compare two manufacturing settings. The alternative hypothesis is that the new settings result in a higher mean response than the old settings. You run a power analysis and decide to collect data on seven batches for each setting, for a total sample size of 14 batches. You then calculate the test statistic based on the difference between the average of the batches at the new setting and the average of the batches at the old setting. The test is an upper-tailed test, so you will reject the null hypothesis if this test statistic is too big in the positive direction. Next, you calculate the p-value. You will reject H0 if p < $\alpha$ and fail to reject H0 if p > $\alpha$.
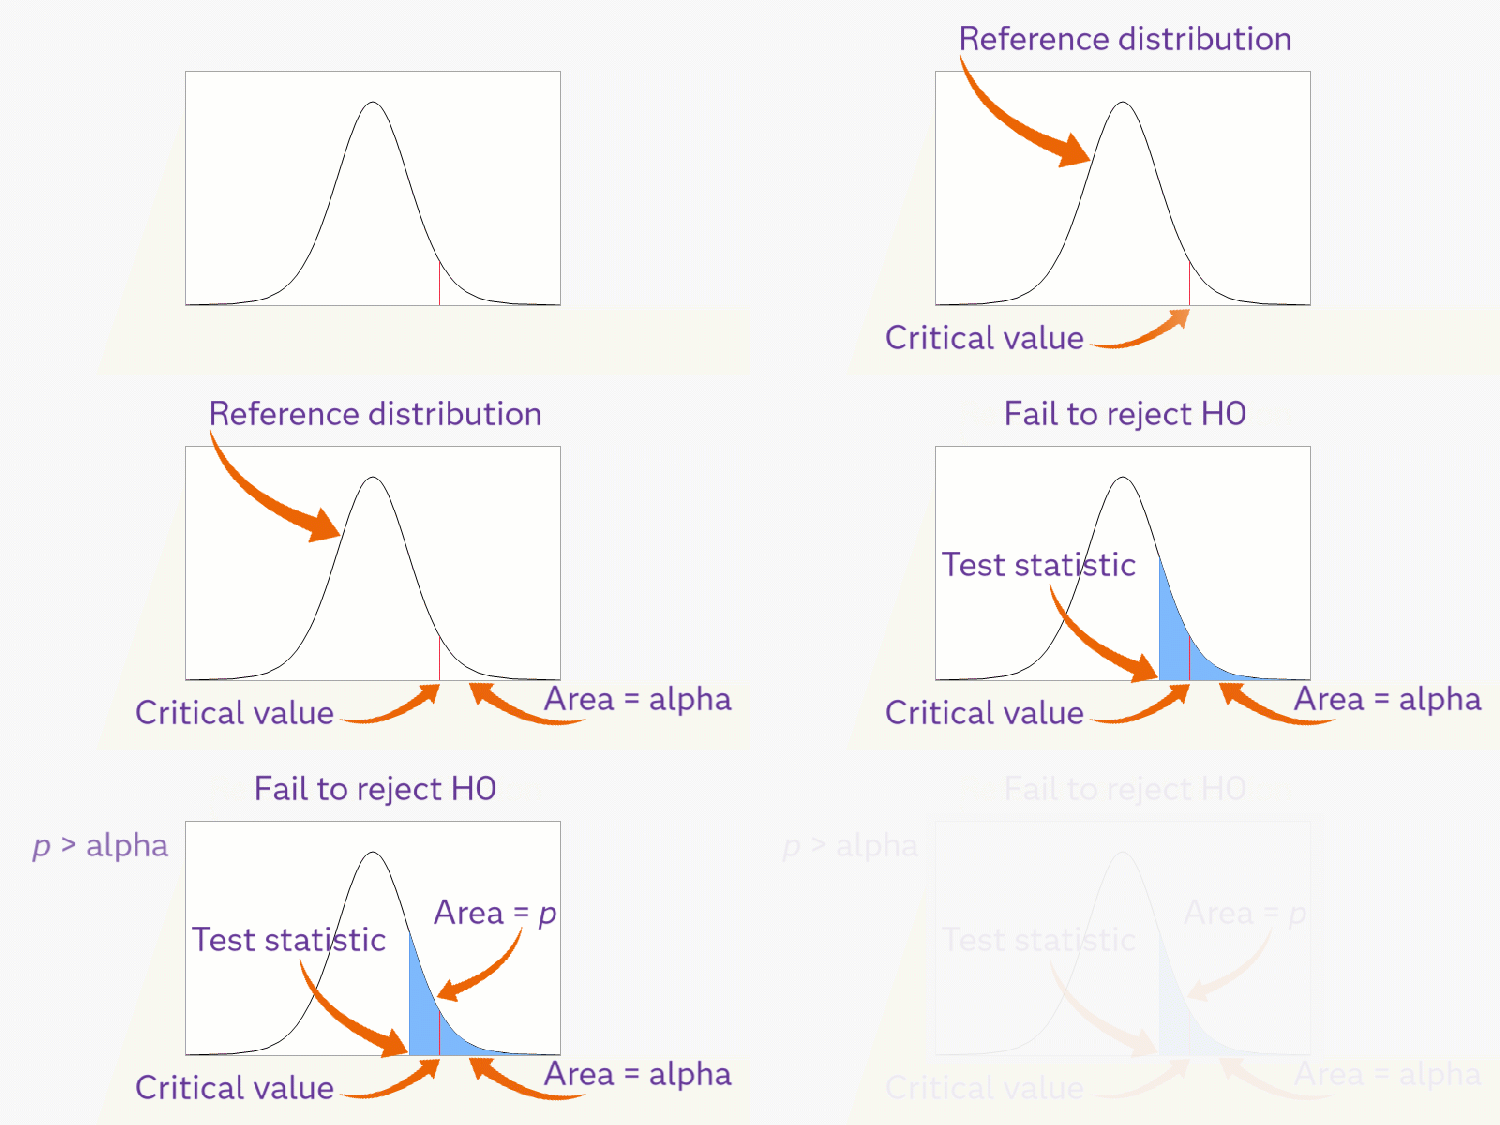
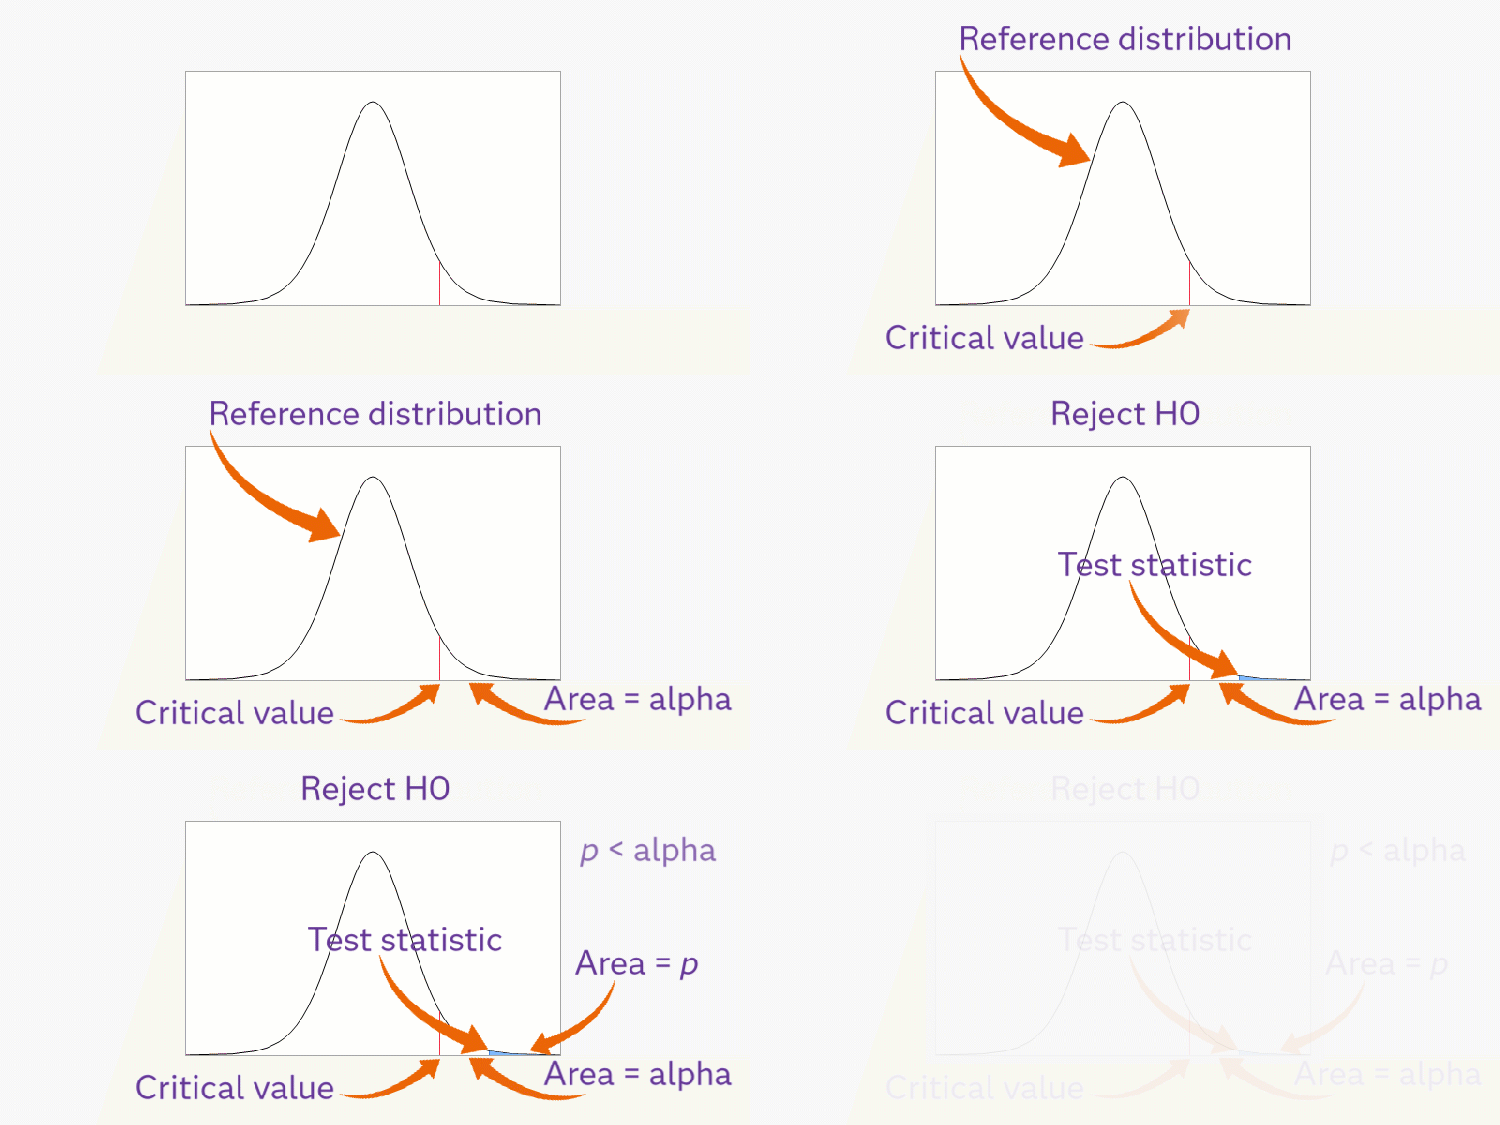
The animations below show the reference distribution (t with 12 df) of the hypothesis test. The area under the curve to the right of the critical value is the significance level $\alpha$. The area under the curve to the right of the calculated test statistic is the p-value.
When p > $\alpha$, you fail to reject H0 and conclude the new setting is not better than the old setting.
When p < $\alpha$, you reject H0 and conclude the new setting is better than the old setting.
What is a good significance level to use?
A significance level, often denoted $\alpha$, is the cutoff used to decide when a p-value is small enough to be considered statistically significant. A common choice is 0.05, but that value is not a universal rule. When choosing the significance level for your test, consider the goals of the study and the consequences of different types of errors. If a false positive (rejecting the null hypothesis when it’s true) is costly, a smaller significance level might be appropriate. If missing a real effect (failing to reject the null hypothesis when it’s false) would be more concerning, a larger significance level might be needed. The key is to choose the significance level before analyzing the data and to explain why it is appropriate.
For example, suppose you are screening thousands of molecules to identify candidates for future research. In that setting, overlooking a potentially important molecule might be more costly than allowing some ineffective molecules to pass, because the promising candidates will be tested again in later screening stages. You might, therefore, choose a relatively high significance level, such as 0.30. In contrast, if you have substantial process knowledge and have tested the same effects many times, a false signal might be more costly. In that case, a lower significance level, such as 0.02, might be more appropriate.
What is statistical significance vs. practical significance?
Statistical significance means that the data provide enough evidence, according to a chosen significance level, to reject the null hypothesis. Practical significance asks whether the effect is large enough to matter in the real world. These are different ideas. With a large sample, a small and unimportant difference can be statistically significant. What might look like a large effect from your perspective might not be statistically significant. Good statistical practice considers both the strength of the evidence and the practical consequences of the estimated effect. Any time you have statistical significance, you should follow up by evaluating practical significance.
For example, suppose a large, well-designed study finds that taking daily vitamin C tablets in winter reduces the overall risk of catching a cold from 25% to 23%. The difference in risk is statistically significant at $\alpha$ = 0.0001, but is the difference meaningful to you? Is it worth the expense, hassle, and potential side effects to take extra vitamin C during the winter? Many people would say no. The following graph shows the small practical difference between 23% and 25%.

What does a p-value not tell you?
A p-value does not tell you the probability that the null hypothesis is true. It also does not tell you the probability that the results happened by chance, the size of the effect, or whether the result is important in a practical sense. A very small p-value can occur with a trivial effect if the sample size is large, and a meaningful effect can fail to reach statistical significance if the sample size is small. For these reasons, p-values should always be considered alongside effect sizes, study design and assumptions, subject-matter knowledge, and the purpose of the study.
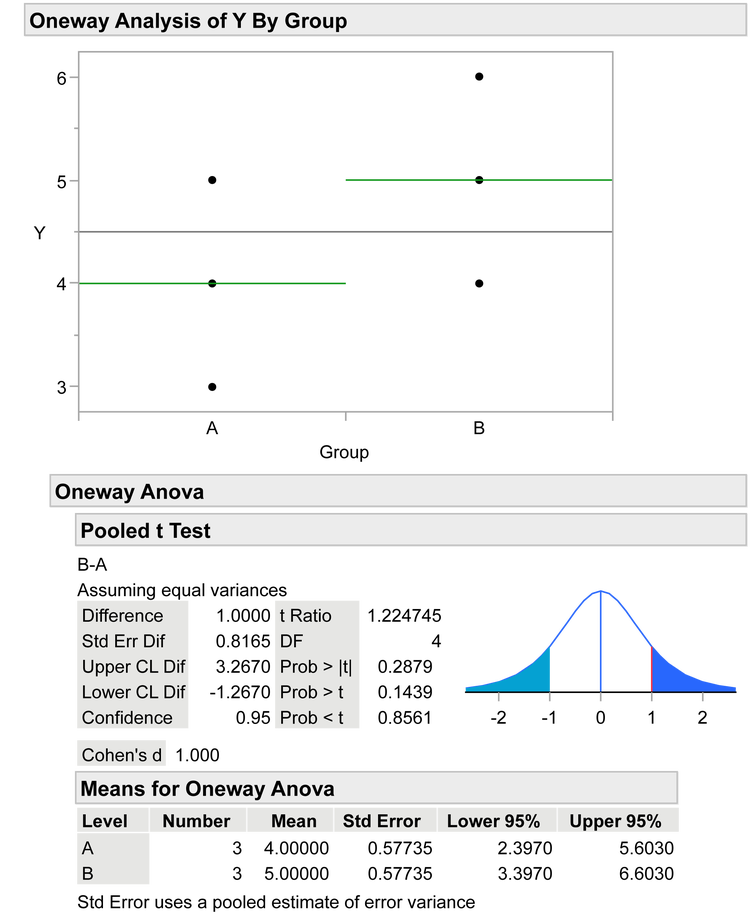
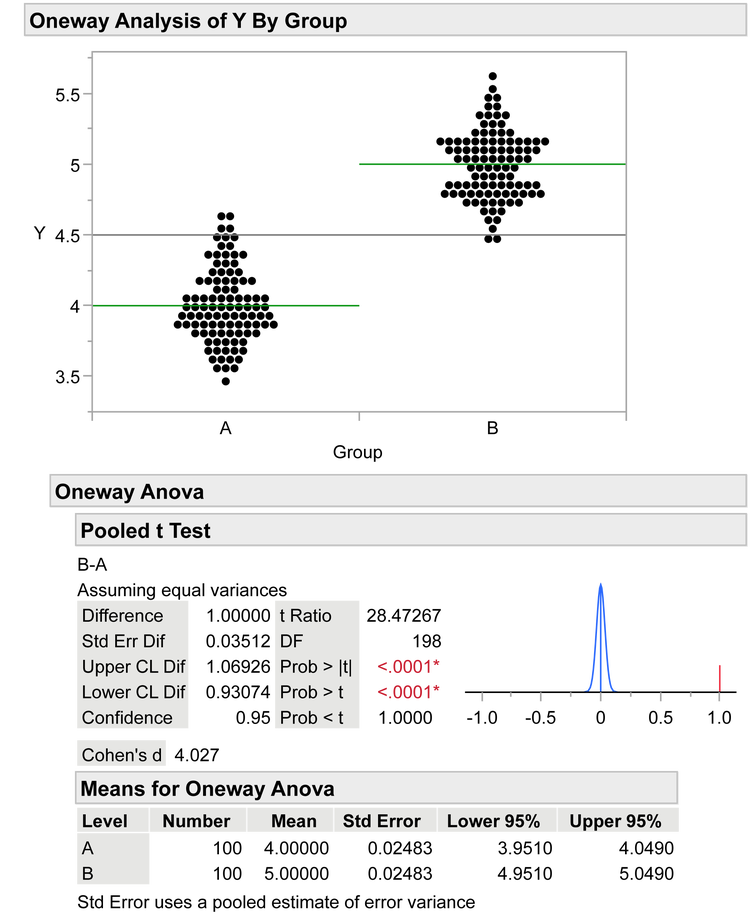
The graphs below show the results of two two-sample t-tests. There is a small sample size for the data on the left graph and a large sample size for the data on the right graph. For both data sets, the sample mean of Group A is 4, and the sample mean of Group B is 5. The p-value on the left is large (fail to reject H0); the p-value on the right is small (reject H0).