Tests for Unequal Variances
What are tests for unequal variances?
Many common statistical tests, including one-way ANOVA, assume that the groups being compared have equal variances. Tests for unequal variances help you check that assumption. You might also hear it described as testing for heterogeneity of variances.
If the appropriate test for unequal variances shows that the groups have different variances, Welch’s ANOVA for the means can be used in place of the usual ANOVA.
Types of tests for unequal variances
| Test | Number of groups | When to use |
| Informal check | Any | Before applying formal test |
| F test | Two | Normally distributed data Balanced data or nearly balanced |
| Bartlett | More than two | Normally distributed data Balanced data or nearly balanced |
| O’Brien | More than two | Mild departures from normality |
| Levene | More than two | Good general-purpose test for symmetric data |
| Brown-Forsythe | More than two | Good general-purpose test for non-symmetric data |
Informal check
Before applying any statistical test, it is important to understand the nature of your data through graphing. Look at a plot of the response variable by the grouping variable and use it to determine if the variability looks similar or different among the groups. Does the variability between groups look bigger than, smaller than, or about the same as the variability within groups?
Also, consider the estimates of the standard deviations for each group. Remember that the standard deviation is the square root of the variance. If the biggest standard deviation is more than twice the smallest standard deviation, then your assumption of equal variance might not hold.
Bartlett’s test of unequal variance
Bartlett’s test compares the weighted arithmetic mean of the sample variances to the weighted geometric mean of the sample variances. The geometric mean is always less than or equal to the arithmetic mean, with equality holding only when all sample variances are equal. The more variation there is among the group variances, the more these two means differ. Bartlett’s test is not very robust to violations of the normality assumption.
Levene’s test of unequal variances
Levene’s test uses a one-way ANOVA, where the response variable is the absolute value of the difference between the data and the mean of the group. That is, replace each data value $x_{ij}$ with $|x_{ij}$ - $\bar{x}_i|$ for each value $j = 1, \ldots, n_i$ within each group $i = 1, \ldots, k$. Levene’s test is a good general-purpose test when data are symmetric within groups.
The Brown-Forsythe test of unequal variance
The Brown-Forsythe test is similar to Levene but uses the distance to the group median instead of the group mean. That is, replace each data value $x_{ij}$ with $|x_{ij}$ - $\tilde{x}_i|$ for each value $j = 1, \ldots, n_i$ within each group $i = 1, \ldots, k$. Brown-Forsythe is a good general-purpose test to use when data are not symmetric within groups. This test is often a good choice to use when group sample sizes are small, and you don’t know much about the shape of the distribution.
O’Brien’s test of unequal variance
O’Brien’s test constructs a dependent variable so that the group means of the new variable are the group sample variances of the original response. An ANOVA on the O’Brien variable is actually an ANOVA on the group sample variances. This test is more robust to departures from normality than Bartlett’s test, but Brown-Forsythe can be a better option when you don’t know the distribution within groups.
Example of testing for unequal variance
Suppose you grow a certain variety of roses in order to sell the blooms. You can charge more for larger blooms. You have many rose bushes of this one variety and would like to know if the distribution of the size of the blooms varies with the type of fertilizer you apply. You have five different fertilizers to test on 10 plants per fertilizer. You measure the diameter in cm of a randomly chosen flower at its peak on each plant. The data are shown in the table below.
| FERT1 | FERT2 | FERT3 | FERT4 | FERT5 |
| 4.9 | 7 | 7 | 6 | 9 |
| 5 | 17.1 | 6.9 | 9.6 | 2.5 |
| 6.9 | 13.9 | 10.9 | 6.8 | 5.7 |
| 6 | 9.5 | 12.8 | 3.9 | 7.2 |
| 5.1 | 18.4 | 3 | 10 | 5.6 |
| 7.8 | 10.2 | 1.8 | 6.1 | 7.5 |
| 8.2 | 5.7 | 10.8 | 7.4 | 7.5 |
| 8 | 1.4 | 9.3 | 6.5 | 8.9 |
| 8.2 | 7 | 7 | 8.8 | 7.9 |
| 6.9 | 7 | 21.8 | 9.3 | 11.1 |
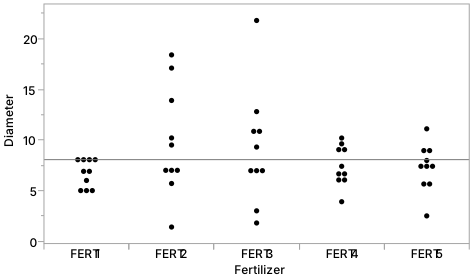
A graph of the data shows the distribution of bloom diameters for each fertilizer. The variability for FERT2 and FERT3 appears to be higher than the variability for the other fertilizers.
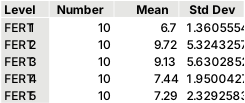
The group sample sizes, means, and standard deviations are in the following table. The biggest standard deviation (5.63) is about four times larger than the smallest standard deviation (1.36).
The figure below shows the results of the four tests of unequal variances. Which test is appropriate? The data appear to be symmetric within the groups, so Levene’s test is a good choice. This test has a small p-value of 0.0092, indicating the groups have different variances.
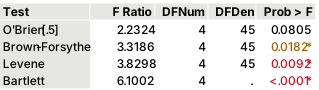
Note that the tests conflict with one another. The strength of evidence against the null hypothesis of equal group variances differs with each test. The nature of the data should guide you on which test to use. In general, use Levene with symmetric data and Brown-Forsythe with skewed data.
Because the variances are different, you might choose to use Welch’s ANOVA rather than a usual one-way ANOVA to test if there is a difference among means across the fertilizers.
Using unequal variance tests in practice
For unequal variance tests, the null hypothesis is equality of the group variances. In many applications, that is the result you are hoping for, because it supports using the one-way ANOVA model to test differences in group means. A non-significant result does not prove that the variances are equal; it only means the test did not find strong evidence that they differ. For that reason, think carefully about the significance level you use, especially when the variance test is serving as a decision point for choosing between one-way ANOVA and a less powerful test such as Welch’s ANOVA. You might consider using a larger significance level so you don’t miss real differences in variance, or you might consider using a smaller significance level to avoid false alarms.