Welch’s t-Test and Welch’s ANOVA
What is Welch's t-test?
Welch’s t-test is an alternative to the two-samplet-test when the assumption of equal variances is not valid.
What is Welch's ANOVA?
Welch’s ANOVA is a generalization of Welch’s two-sample t-test for more than two groups, that is, for one-way ANOVA.
When should you use Welch's test?
You would use Welch’s t-test or Welch’s ANOVA only after you decide that the groups have different variances or when you have very small sample sizes and can’t verify the equal variance assumption.
There are two main features of Welch’s test statistic that are different from the usual two-samplet-test or one-way ANOVA.
First, the variances are not pooled in the denominator. Instead, each variance is scaled by its group’s sample size, then the group variances are summed. The test statistic for the two-sample t-test is $\frac{\overline{X}_1-\overline{X}_2}{\sqrt{s^2_{\text{pooled}}}}$, while the Welch’s test statistic is $\frac{\overline{x}_1-\overline{x}_2}{\sqrt{\frac{s_1^2}{n_1}+\frac{s_2^2}{n_2}}}$. So, instead of using one pooled variance estimated from all the data, we are splitting the variance by group.
Second, the degrees of freedom need to be adjusted since the variance estimator has changed. Since the variance estimator is different, the degrees of freedom are different. Statistical software can be used to find the degrees of freedom. The key point to remember is that if you cannot use the pooled estimate of variance, then you cannot use the simple formula for degrees of freedom.
Example of Welch's ANOVA
Suppose you grow a certain variety of roses in order to sell the blooms. You can charge more for larger blooms. You have many rose bushes of this one variety and would like to know if the distribution of the size of the blooms varies with the type of fertilizer you apply. You have five different fertilizers to test on 10 plants per fertilizer. You measure the diameter in cm of a randomly chosen flower at its peak on each plant. The data are shown in the table below.
| FERT1 | FERT2 | FERT3 | FERT4 | FERT5 |
| 4.9 | 7 | 7 | 6 | 9 |
| 5 | 17.1 | 6.9 | 9.6 | 2.5 |
| 6.9 | 13.9 | 10.9 | 6.8 | 5.7 |
| 6 | 9.5 | 12.8 | 3.9 | 7.2 |
| 5.1 | 18.4 | 3 | 10 | 5.6 |
| 7.8 | 10.2 | 1.8 | 6.1 | 7.5 |
| 8.2 | 5.7 | 10.8 | 7.4 | 7.5 |
| 8 | 1.4 | 9.3 | 6.5 | 8.9 |
| 8.2 | 7 | 7 | 8.8 | 7.9 |
| 6.9 | 7 | 21.8 | 9.3 | 11.1 |
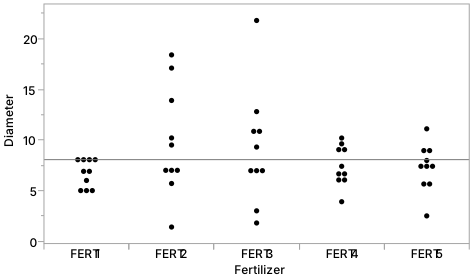
A graph of the data shows the distribution of bloom diameters for each fertilizer. The variability for FERT2 and FERT3 appears to be higher than the variability for the other fertilizers.
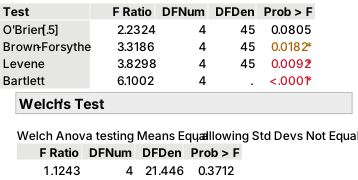
The figure below shows the results of four tests for unequal variances and Welch’s ANOVA. Levene’s test is appropriate for these data, since the data are roughly symmetric within each group. Levene’s test has a small p-value of 0.0092, indicating the groups have different variances. Therefore, the one-way ANOVA assumption of equal variance in the groups is violated. In this case, Welch’s ANOVA is appropriate to test the means. Welch’s ANOVA has a large p-value of 0.3712, indicating the group means are not different.