Gamma Distribution
What is the gamma distribution?
The gamma distribution is a continuous probability distribution that is used to model positive values such as amounts or waiting times. It is especially useful when the quantity of interest is the result of several random events accumulating over time. The gamma distribution is related to several other distributions, including the exponential and chi-square distributions.
What are some examples of the gamma distribution?
The gamma distribution is widely used in reliability analysis, queuing systems, insurance applications, and many areas of science and engineering because it can model a broad range of positive-valued data. Examples of the gamma distribution include:
- Daily rainfall amounts.
- The size of insurance claims.
- Failure times or time between failures in reliability analysis.
- Waiting time until a specified number of events occurs.
- Service times in customer support or healthcare settings.
When should I consider using the gamma distribution?
The gamma distribution is useful when modeling positive continuous measurements that tend to be right-skewed. It is commonly used for amounts, such as rainfall totals or insurance claims, and for waiting times.
Because the gamma distribution is related to the exponential distribution, it is especially useful when studying the time required for several events to occur. For example, an exponential distribution might model the waiting time until the next customer arrives, while a gamma distribution can model the waiting time until the tenth customer arrives.
You also might want to model a Gamma response variable as a function of independent factors. Penalized regression or generalized linear models can be used for this type of analysis.
Characteristics of the gamma distribution
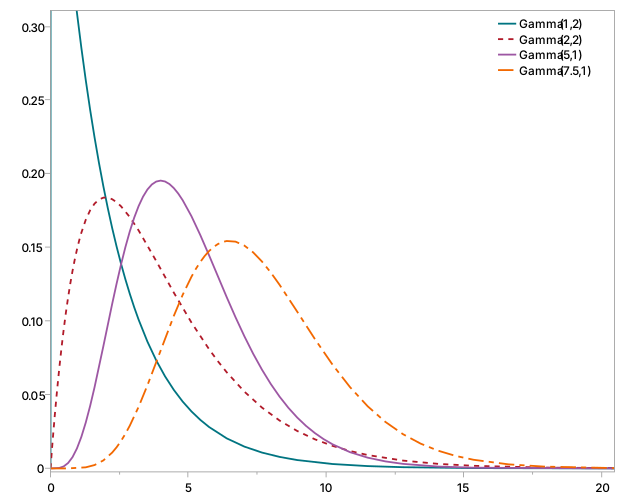
The gamma distribution is a flexible family of distributions. Changing the shape parameter ($\alpha$) alters the overall shape of the distribution, while changing the scale parameter ($\theta$) stretches or compresses it along the horizontal axis. This flexibility allows it to represent both highly skewed and more symmetric distributions depending on the parameter values.
Several commonly used distributions are special cases of the gamma distribution. For example, a chi-square distribution with d degrees of freedom is a gamma distribution with shape d/2 and scale 2. The exponential distribution is also a special case of the gamma distribution where the shape = 1 and the scale parameter is the same as the rate parameter of the exponential ($\lambda$).
| Model parameters | $\alpha$, shape parameter $\theta$, scale parameter |
| Density function | $f(x) = \frac{1}{\Gamma(\alpha) q^{\alpha}} x^{\alpha - 1} e^{-x/q}, \; x > 0,\; \alpha > 0,\; q > 0$ |
| Mean | $\alpha$$\theta$ |
| Variance | $\alpha$$\theta^2$ |
The graph below shows gamma probability density functions for several combinations of shape and scale parameters ($\alpha$, $\theta$).
Example of a Gamma random variable
Suppose the amount of an insurance claim is modeled by a gamma distribution with shape parameter $\alpha$ = 2.8 and scale parameter $\theta$ = 2600, and a mean claim amount of $\alpha$$\theta$ = $7,280.
What is the probability that the company will have to pay out more than $20,000 in one claim?
Let the random variable X represent the amount of a randomly selected insurance claim. Then
X ~ Gamma($\alpha$ = 2.8, $\theta$ = 2600).
The probability of interest is the area under the gamma probability density function to the right of $20,000.
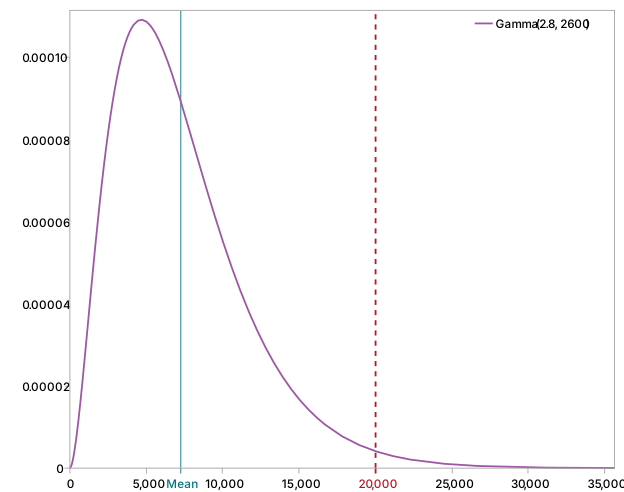
Using the gamma cumulative distribution function, the probability can be computed from statistical software or distribution tables, with the result P(X > 20,000) = 0.0135, or 1.35%.
This probability represents the chance that a randomly selected claim exceeds $20,000.
Large claims are relatively uncommon because $20,000 is substantially larger than the mean claim amount of
$\alpha$$\theta$ = $7,280.