Adverse Events Risk Report
This report screens all adverse eventsand calculates and generates forest plots of risk differences, relative risks or odds ratios.
Report Results Section
Running Adverse Events Risk Report using the Nicardipine sample data for risk differences generates the report shown below.
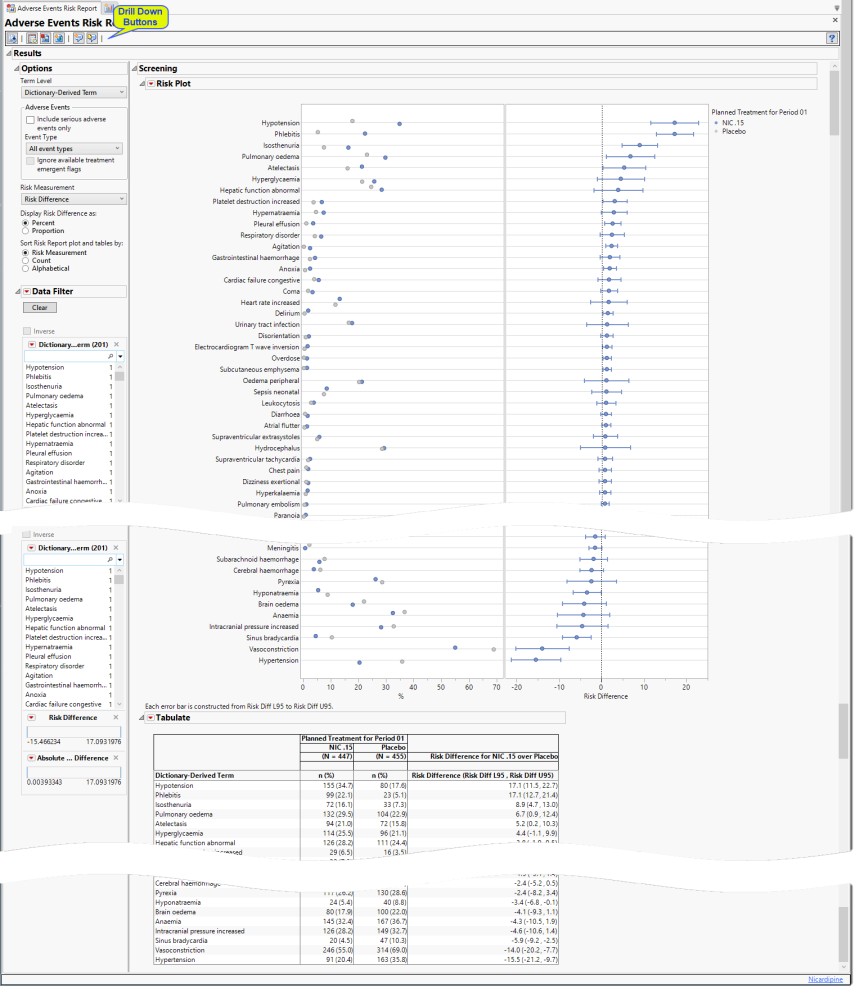
The Report contains the following elements:
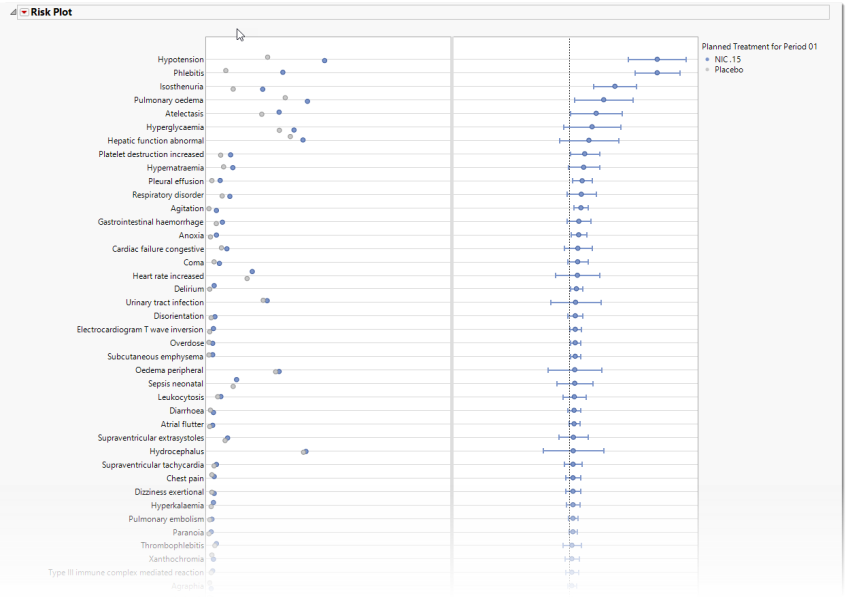
Risk Plot
This section contains the following elements:
| • | One Forest Plot showing the risk difference measurements with 95% confidence intervals for all of the adverse events exhibited by the subjects. In the plot shown below, the risk difference with unadjusted 95% confidence intervals1 for each event are presented. Events shown are restricted to the specified group or term level, when specified. |
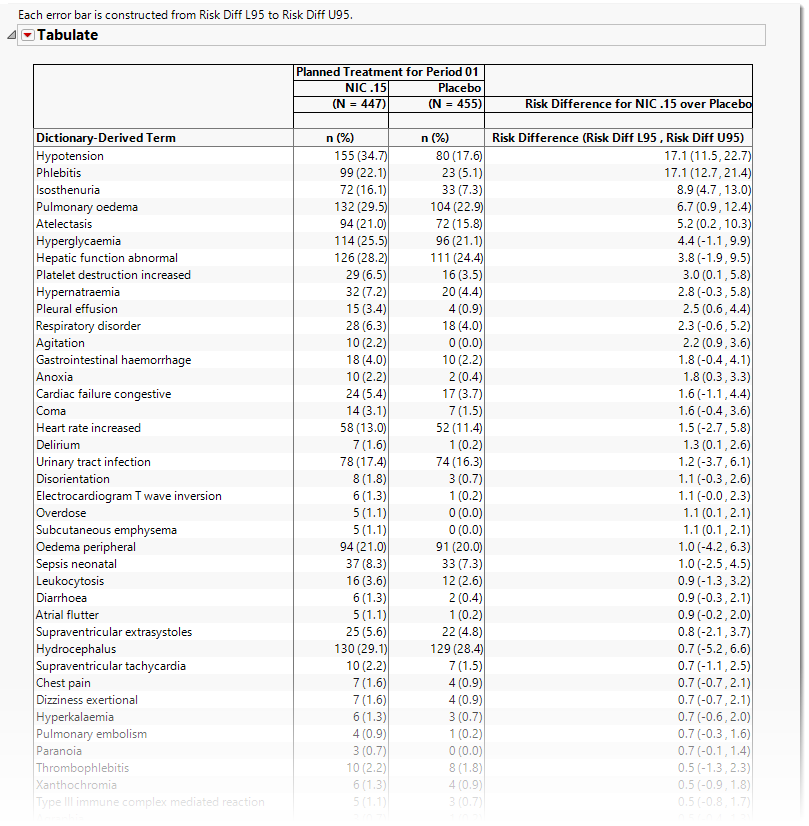
Tabulate
| • | The table presents an alternate view, listing the subject counts experiencing an event and the respective percent of subjects (in parentheses) on each treatment arm, as well as the risk difference and 95% confidence interval (in parentheses) for the terms (or those terms falling under selected groups, when specified). |
Report Data Filters
These filters enable you to subset and view subjects based on demographic characteristics and other criteria. Refer to Data Filter for more information.
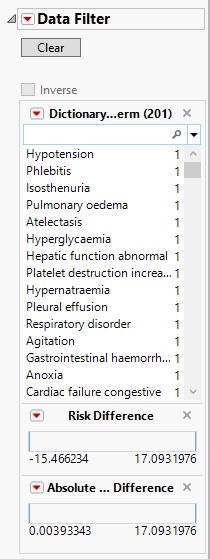
Note: Filter specifications are reapplied when any widget options are changed.
Options
Use the widgets on this panel to customize your analysis.
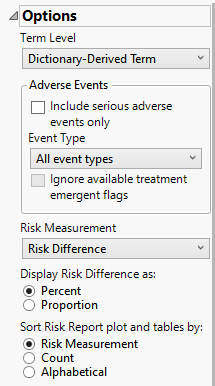
Term Level
Term Levels are determined by the coding dictionary for the Event domain of interest, typically these levels follow the MedDRA dictionary. Use this widget to specify how each adverse event is named and the level at which the event is considered. For example, selecting Reported Term reports the event specified by the actual event term as reported in the AE domain . Refer to Term Level for more information.
Include serious adverse events only
By default, all events are included in the analysis. However, you can opt to include only those considered serious. Checking the Include serious adverse events only widget restricts the analysis to those adverse events defined as Serious under FDA guidelines.
Event Type
Analysis can consider all events or only those that emerge at specific times before, during, or after the trial period. For example, selecting On treatment events as the Event Type includes only those events that occur on or after the first dose of study drug and at or before the last dose of drug (+ the offset for end of dosing).
Ignore available treatment emergent flags
If you choose to Ignore available treatment emergent flags, the analysis includes all adverse events that occur on or after day 1 of the study.
Risk Measurement
You have the option of calculating either the Risk Difference, the Relative Risk, or the Odds Ratio as the Risk Measurement.
Display Risk Difference as:
Use this widget to specify the difference between the risk of an event in the treatment arm and the control arm as either a percentage or a proportion of the total subject population. This widget appears only when you select Risk Difference as the Risk Measurement.
Sort Risk Report plot and tables by:
Use the Sort Risk Report plot and tables by: widget to specify how the rows in the Risk Report plot and tables are to be sorted..
General and Drill Down Buttons
Action buttons, provide you with an easy way to drill down into your data. The following action buttons are generated by this report:
| • | Click  to rerun the report using default settings. to rerun the report using default settings. |
| • | Click  to view the associated data tables. Refer to Show Tables/View Data for more information. to view the associated data tables. Refer to Show Tables/View Data for more information. |
| • | Click  to generate a standardized pdf- or rtf-formatted report containing the plots and charts of selected sections. to generate a standardized pdf- or rtf-formatted report containing the plots and charts of selected sections. |
| • | Click  to generate a JMP Live report. Refer to Create Live Report for more information. to generate a JMP Live report. Refer to Create Live Report for more information. |
| • | Click  to take notes, and store them in a central location. Refer to Add Notes for more information. to take notes, and store them in a central location. Refer to Add Notes for more information. |
| • | Click  to read user-generated notes. Refer to View Notes for more information. to read user-generated notes. Refer to View Notes for more information. |
Default Settings
Refer to Set Study Preferences for default Subject Level settings.
Methodology
Patients are assessed for each adverse event they experience and Percent Occurrence and Risk Difference are calculated for each event by treatment group. Percent Occurrence is simply the percentage of patients in a treatment group who experience the adverse event at least once during the trial period. Risk difference is calculated by subtracting the number of patients exhibiting the adverse event in the control group from the number of patients exhibiting the event in the treatment arm.