Set Study Preferences
This study management action enables you to globally set custom study-level attributes, subject-level preferences, analysis preferences for each CDISC class of reports, preferences for calculating study days, as well as preferences for advanced operations. A subset of these study-level preferences are also available on individual reports and are used as initial values for report options, but can be overridden in reports either through review templates or interactively.Some categories in this dialog are only available if they are applicable to the study data.
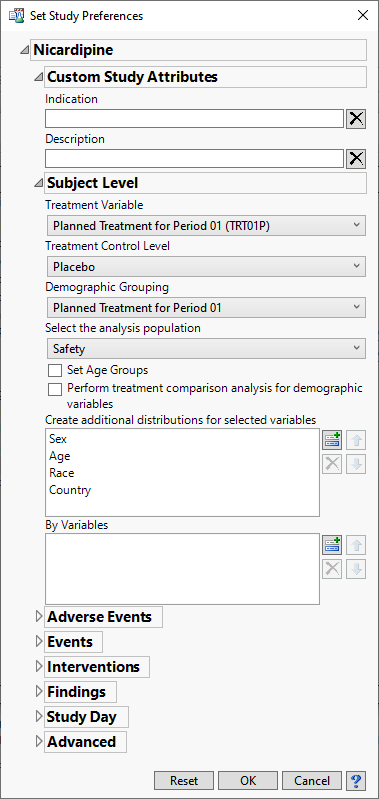
| 8 | Click  to expand each section and specify preferences. to expand each section and specify preferences. |
Custom Study Attributes
Options shown in this category are determined by the Manage Configurations > System Preferences > Study Management > Custom Study Attributes specification, so this category will be shown only if at least one custom study attribute key has been defined. All studies for a given configuration will display the same set of custom study attributes in the Set Study Preferences dialog. These attributes are displayed on the study information panel of study selector windows, and always appear at the top of the panel.
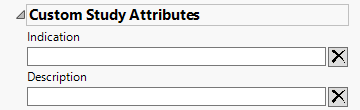
The Indication and Description options are shown by default. This is a place for the user to enter descriptive text regarding the study
Indication
The Indication is simply a short phrase about what the study’s general focus is, or the presumptive use for the drug being investigated.
Description
The Description is longer and more open-ended than the Indication. Use this field to expand on any details about the study that you may feel relevant to reviewers or others users.
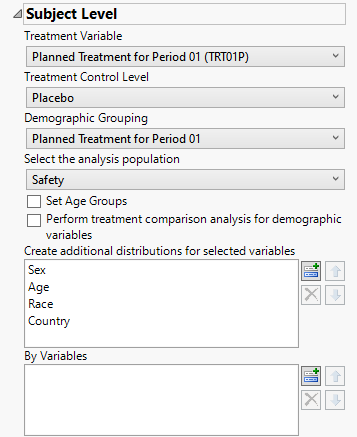
Subject Level Preferences
This category includes treatment variable, treatment control value, demographic grouping, and analysis population choices, among others. Some of these preferences are not available on individual reports.
Note: JMP Clinical automatically tries to assign default values for each of the subject level preferences based on flags found in the ADSL, ADDM, or DM (and optionally SUPPDM) data sets as well as prior selections. Use the individual widgets to modify the selections.
Treatment Variable
Use the Treatment Variable widget to specify the variable defining the actual or planned treatment used in the study. Available variables might include either a planned treatment , which is selected when the treatments patients received exactly match what was planned the variable specifying the actual treatmentActual, which is selected when treatment deviates from what was planned. You can also specify any demographic variable from DM and/or ADSL as a surrogate for the treatment variables.
Treatment Control Level
Use this widget to specify the term used in the Treatment variable to specify the study's control. The Treatment Control Level is specified as either “Placebo” or “Pbo”, depending on the value found in your data, by default.
Demographic Grouping
Use this widget to specify the Demographic Grouping to use for segregating the results of your analysis.
Select the analysis population
This list is populated with available populations that can be defined for the current Study based on flags found in the ADSL, ADDM, or DM (and optionally SUPPDM) data sets. Use the drop-down menu to select the set of individuals to include in the analysis.
Set Age Groups
Check the Set Age Groups check box if you want to group study subjects by age.
Perform treatment comparison analysis for demographic variables.
Check this box to generate the treatment comparisons among the selected demographic variables.
Create additional distributions for selected variables
This option enables you to add or remove demographic variables from DM from the distributions.
| 8 | Click  to open the Add window shown below: to open the Add window shown below: |
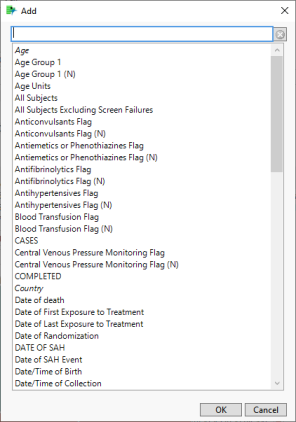
| 8 | Select one or more variables and click . |
| 8 | To remove one or more distributions, highlight the variables to be deleted and click  . . |
| 8 | To rearrange the order of the distributions, select a variable and click either  or or  . . |
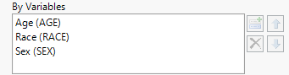
By Variables
BY variables are optional (in most reports) variable specifications whose values define groups of observations, such as hour, month, or year. BY variables can enable analyses to be performed separately on different groups as defined by that variable. Choosing a BY variable such as gender (ADSL variable = SEX), for example, groups the subjects by gender and conducts two separate analyses: one for males and one for females.
Alternatively, specifying a BY variable enables you to animate an image so that you can see how response values change according to some grouping over time.
| 8 | Click  to open the Add window (shown below) that lists each variable contained in domain and SUPPxx (if merged) specific to this report to open the Add window (shown below) that lists each variable contained in domain and SUPPxx (if merged) specific to this report |
Note: In Demographics Distribution only, variables are taken from ADSL, in addition to the report-specific DS and SUPPPDS (if available) data sets.
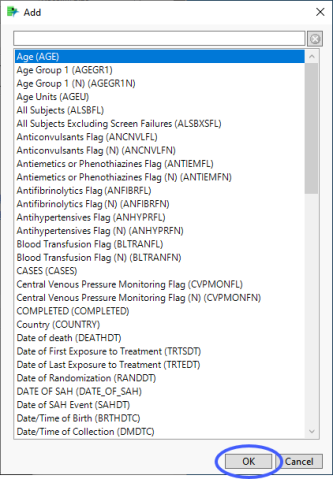
| 8 | Select the variables that you want to include in the analysis and click to add those variables to the text box. |
In this example, AGE, RACE, and SEX were selected and added.
Note: If no BY variables are specified, the analysis is conducted across all the subjects
Adverse Events Preferences
This category is available if the study contains an adverse events data set.
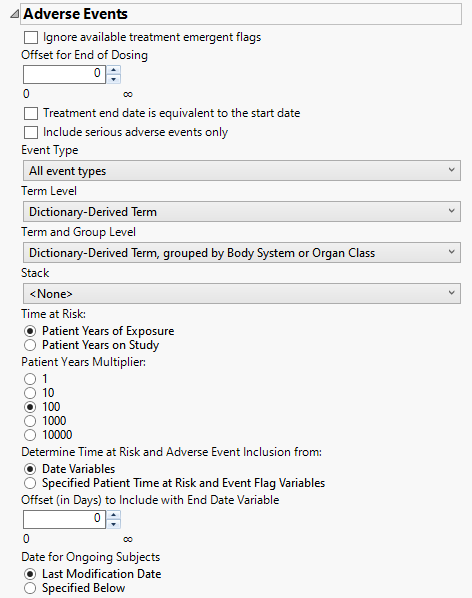
Ignore available treatment emergent flags
If you choose to Ignore available treatment emergent flags, the analysis includes all adverse events that occur on or after day 1 of the study.
Offset for End of Dosing
By default, post-treatment monitoring begins after the patient receives the last treatment. However, you might want to specify an Offset for End of Dosing, increasing the time between the end of dosing and post-treatment monitoring for treatments having an extended half-life.
Include serious adverse events only
Check the Include serious adverse events only check box to include only serious adverse events in the analysis. Serious events are identified by a “Y” value in the expected AESER variable in AE or ADAE.
Event Type
Analysis can consider all events or only those that emerge at specific times before, during, or after the trial period. For example, selecting On treatment events as the Event Type includes only those events that occur on or after the first dose of study drug and at or before the last dose of drug (+ the offset for end of dosing).
Term Level
Use the Term Level widget to specify which level of terms to use as categories.
Term and Group Level
Term and Group Levels are determined by the coding dictionary for the Event or Intervention domain of interest, typically these levels follow the MedDRA dictionary. You must indicate how each adverse event is named and the level at which the event is considered. For example, selecting Reported Term for the Adverse Event, grouped by Body System or Organ Class reports the event specified by the actual event term as reported in the AE domain on the affected organ or body system.
Stack
Use the Stack widget to distinguish different levels within each of the adverse events summarized on the same the bar in the plots.
Time at Risk
Use the Time at Risk: widget to specify how to calculate each patient's duration in patient years. If the Time at Risk is calculated from specified patient time at risk and event flag variables, then it is assumed that the variables that you select appropriately match the selection on this dialog for clear communication of results on the report output.
Patient Years Multiplier
The selection of the incidence rate multiplier can be dependent on the number of subjects in a study and the cumulative time on study/treatment. Use the Patient Years Multiplier: widget to select a multiplier for incidence rates for better interpretability and comparison among studies.
Determine Time at Risk and Adverse Event Inclusion from:
Use the Determine Time at Risk and Adverse Event inclusion from: widget to specify whether JMP Clinical should calculate patient years and event inclusion based on study date variables or from derived patient years/time at risk and event inclusion flags.
Offset (in Days) to Include with End Date Variable
Use the Offset (in Days) to Include with End Date Variable widget to specify the number of days after the last date of study or exposure for calculation of patient time at risk and adverse event variable inclusion.
Date for Ongoing Subjects
Use the Date for Ongoing Subjects widget to specify an end date for subjects that are continuing in the clinical trial.
Clinical Events
This category is available if the study contains a clinical events data set.
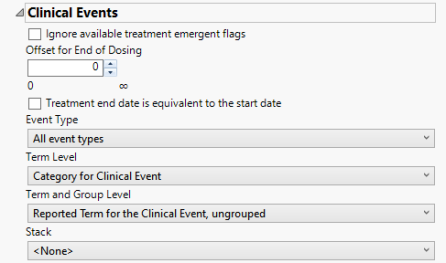
Ignore available treatment emergent flags
If you choose to Ignore available treatment emergent flags, the analysis includes all adverse events that occur on or after day 1 of the study.
Offset for End of Dosing
By default, post-treatment monitoring begins after the patient receives the last treatment. However, you might want to specify an Offset for End of Dosing, increasing the time between the end of dosing and post-treatment monitoring for treatments having an extended half-life.
Event Type
Analysis can consider all events or only those that emerge at specific times before, during, or after the trial period. For example, selecting On treatment events as the Event Type includes only those events that occur on or after the first dose of study drug and at or before the last dose of drug (+ the offset for end of dosing).
Term Level
Use the Term Level widget to specify which level of terms to use as categories.
Term and Group Level
Term and Group Levels are determined by the coding dictionary for the Event or Intervention domain of interest, typically these levels follow the MedDRA dictionary. You must indicate how each adverse event is named and the level at which the event is considered.
Stack
Use the Stack widget to distinguish different levels within each of the clinical events summarized on the same the bar in the plots.
Events
This category is available if the study contains at least one events data set aside from adverse events.
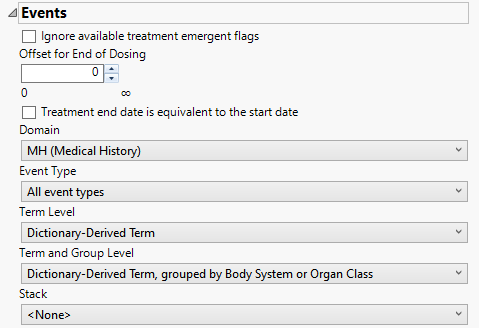
Ignore available treatment emergent flags
If you choose to Ignore available treatment emergent flags, the analysis includes all events that occur on or after day 1 of the study.
Offset for End of Dosing
By default, post-treatment monitoring begins after the patient receives the last treatment. However, you might want to specify an Offset for End of Dosing, increasing the time between the end of dosing and post-treatment monitoring for treatments having an extended half-life.
Domain
Use the Domain option to specify whether to analyze either disposition (DS) or medical history (MH) events.
Event Type
Analysis can consider all events or only those that emerge at specific times before, during, or after the trial period. For example, selecting On treatment events as the Event Type includes only those events that occur on or after the first dose of study drug and at or before the last dose of drug (+ the offset for end of dosing).
Term Level
Use the Term Level widget to specify which level of terms to use as categories.
Term and Group Level
Term and Group Levels are determined by the coding dictionary for the Event or Intervention domain of interest, typically these levels follow the MedDRA dictionary. You must indicate how each adverse event is named and the level at which the event is considered. For example, selecting Reported Term for the Adverse Event, grouped by Body System or Organ Class reports the event specified by the actual event term as reported in the AE domain on the affected organ or body system.
Stack
Use the Stack widget to distinguish different levels within each of the events summarized on the same the bar in the plots.
Interventions
This category is available if the study contains at least one interventions data set.
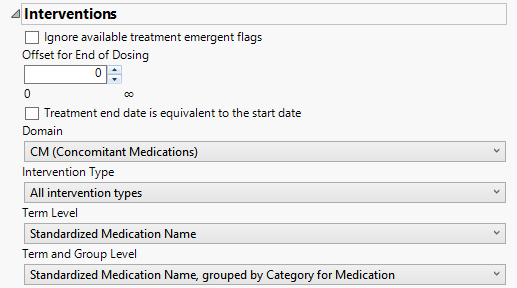
Ignore available treatment emergent flags
If you choose to Ignore available treatment emergent flags, the analysis includes all interventions that occur on or after day 1 of the study.
Offset for End of Dosing
By default, post-treatment monitoring begins after the patient receives the last treatment. However, you might want to specify an Offset for End of Dosing, increasing the time between the end of dosing and post-treatment monitoring for treatments having an extended half-life.
Domain
Use the Domain option to specify whether to analyze either concomitant medication (CM) or exposure (EX) interventions.
Intervention Type
Analysis can consider all events or only those that emerge at specific times before, during, or after the trial period. For example, selecting On treatment interventions as the Intervention Type includes only those interventions that occur on or after the first dose of study drug and at or before the last dose of drug (+ the offset for end of dosing).
Term Level
Use the Term Level widget to specify which level of terms to use as categories.
Term and Group Level
Term and Group Levels are chosen from available variables in the Intervention domain of interest. You must indicate how each intervention is named and the level at which the intervention is considered. For example, selecting Standardized Medication Name, grouped by Category for Medication as the Term Level and Group Level, respectively, reports the intervention within the Medication Category as provided in the CM domain.
Findings
This category is available if the study contains at least one findings data set.
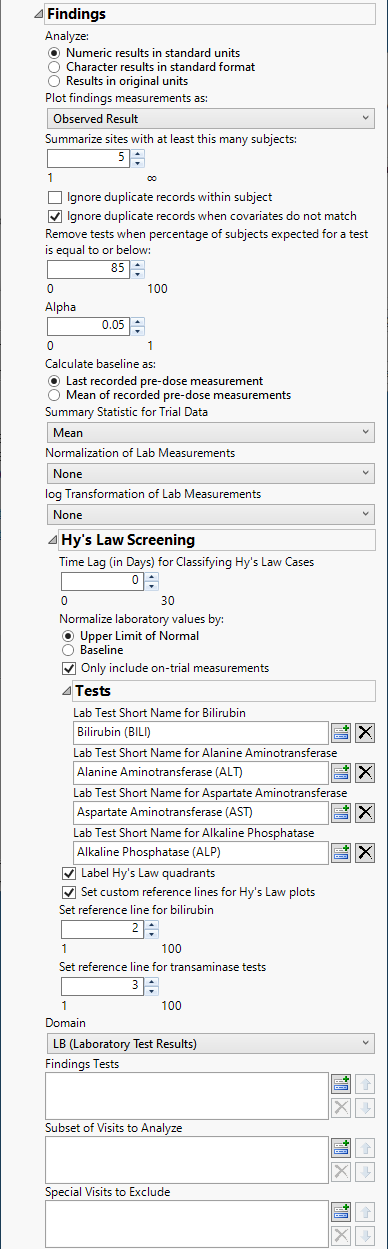
Analyze
Use the Analyze: widget to choose a particular findings variable type to examine for constancy across the study
Plot findings measurements as:
Use the Plot findings measurements as: widget to select the type of findings measurement values to plot.
Summarize sites with at least this many subjects:
Use the Summarize sites with at least this many subjects: widget to specify the number of subjects a site must have in the selected population in order to include it in the summary
Ignore duplicate records when covariates do not match
Check the Ignore duplicate records when covariates do not match check box to prevent the printing of duplicate records when visit number (VISITNUM), location (xxLOC), method (xxMETHOD), position (xxPOS), specimen (xxSPEC) and planned time point (xxTPT) do not match.
Remove tests when percentage of subjects expected for a test is equal to or below:
Use the Remove tests when percentage of subjects expected for a test is equal to or below: widget to specify a threshold level for participating in a test. Tests in which the percentage of subjects receiving that test falls below the set threshold are excluded from the analysis. This option is useful from excluding tests that are conducted only rarely from the analysis. If a test is rare or unexpected at a visit or time point, this option prevents it showing up as missing for the populations of subjects under analysis.
Alpha
Alpha is the false positive or false discovery rate that you desire across all of the hypothesis tests. Alpha must be a real number between 0 and 1; it is typically set at either 0.01, 0.05 or 0.10.
Calculate baseline as:
Use this widget to specify how the baseline findings measurements should be calculated. Refer to Calculate baseline as: for more information.
Summary Statistic for Trial Data
Select the statistic used to summarize the data from the trial period. Refer to Summary Statistic for Trial Data for information about each of the options.
Normalization of Lab Measurements
Use the drop-down menu to select a normalization to be applied to the baseline and on-therapy measurements. Refer to Normalization of Lab Measurements for more information about normalization options.
log Transformation of Lab Measurements
Use the drop-down menu to select the transformation to be applied to the baseline and experimental measurements. Refer to log Transformation of Lab Measurements for more information about available transformations.
Time Lag (in Days) for Classifying Hy's Law Cases
Use the widget to specify a lag time for classifying a subject as a Hy's Law case. Refer to Time Lag (in Days) for Classifying Hy’s Law Cases for more information.
Normalize laboratory values by:
Use this widget to select the reference values to use for performing Hy's Law Screening. Refer to Normalize laboratory values by: for more information.
Only include on-trial measurements
Use this option to filter the laboratory domain records to consider only measurements that are taken after Study Day 1 and are not flagged as baseline. This option is applicable only when you normalize laboratory values by the Upper Limit of Normal. This option does not apply when normalizing by Baseline. Refer to Only include on-trial measurements for more information.
Lab Test Short Name for Bilirubin
Use this text field to specify the Test Short Name (LBTESTCD) value that corresponds to the bilirubin test. By default, attempts to detect common recommended values for the bilirubin test. If it finds one, the report automatically enters it in the text box. If an alternative designation is used in your study, the field is left blank and you must specify the designation. Refer to Lab Test Short Name for Bilirubin for more information.
| 8 | Click to open the Add window (shown below) that that lists available test names (shown below). |
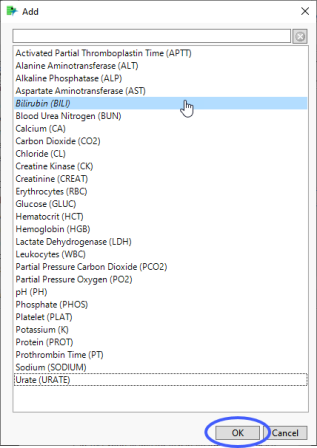
| 8 | Select the short name for bilirubin and click to add it to the text box. |
Lab Test Short Name for Alanine Aminotransferase
Use this widget to specify the Test Short Name (LBTESTCD) value that corresponds to the alanine aminotransferase test, as described for bilirubin. Refer to Lab Test Short Name for Alanine Aminotransferase for more information.
Lab Test Short Name for Aspartate Aminotransferase
Use this widget to specify the Test Short Name (LBTESTCD) value that corresponds to the aspartate aminotransferase test, as described for bilirubin. Refer to Lab Test Short Name for Aspartate Aminotransferase for more information.
Lab Test Short Name for Alkaline Phosphatase
Use this text field to specify the Test Short Name (LBTESTCD) value that corresponds to the alkaline phosphatase test, as described for bilirubin. Refer to Lab Test Short Name for Alkaline Phosphatase for more information.
Label Hy's Law quadrants
Check the box to annotate the plot of Bilirubin against Alanine Aminotransferase with terms relating to Hy’s Law. Refer to Lab Test Short Name for Alkaline Phosphatase for more information.
Set custom reference lines for Hy's Law plots
Check this option to use a custom threshold for drawing reference lines for Bilirubin (on the X axis) and for Alanine Aminotransferase (on the Y axis) of the plot. When this box is checked, you can change the values that you want to draw reference lines using the Set reference line for bilirubin and Set reference line for transaminase tests options. If left unchecked, traditional Hy’s Law reference lines (twice the upper limit of normal (ULN) for bilirubin and three times the ULN for alanine aminotransferase) are drawn.
Set reference line for bilirubin
Use this widget to specify a custom reference line for the bilirubin test (BILI) and alkaline phosphatase test (ALP) to be drawn on the Hy’s Law plot. This same custom threshold is used for both BILI and ALP.
Set reference line for transaminase tests
Use this widget to specify a custom reference line for the alanine transaminase test (ALT) and aspartate transaminase test (AST) to be drawn on the Hy’s Law plot. This same custom threshold is used for both ALT and AST.
Domain
Use the Findings Domain to Analyze option to specify whether to plot the distribution of measurements from either the Electrocardiogram (EG), Laboratory (LB), or Vital Signs (VS) findings domains.
Findings Tests
Use this widget to select specific Findings tests.
| 8 | Click to open the Add window (shown below) that lists available test names (shown below). |

| 8 | Select the desired test(s) and click to add them to the text box. |
Subset of Visits to Analyze
Use this widget to select the visits to be analyzed.
| 8 | Click to open the Add window (shown below) that lists available visits (shown below). |
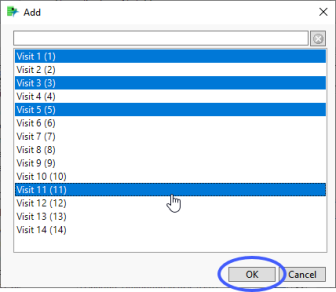
| 8 | Select the desired visit(s) and click to add them to the text box. |
Special Visits to Exclude
Use this widget to select the visits to be excluded from the analysis, as described for the visits to be analyzed.
Study Day
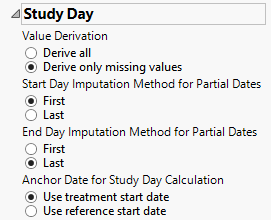
Value Derivation
The Value Derivation widget enables you to derive values for any missing study day data or to rederive all study day values across the study, replacing any existing values.
Start Day Imputation Method for Partial Dates
Use Start Day Imputation Method for Partial Dates to specify whether to use the first moment rule or last moment rule for deriving missing values in the variable indicating the starting day of an event/finding/intervention.
End Day Imputation Method for Partial Dates
Use End Day Imputation Method for Partial Dates to specify whether to use the first moment rule or last moment rule for deriving missing values in the variable indicating the ending day of an event/finding/intervention..
Anchor Date for Study Day Calculation
Use Anchor Date for Study Day Calculation to specify the variable to use for specifying the anchor date for deriving study days for each subject..
Oncology
This category is available if the study contains at least one oncology-related data set (e.g., RS, TR, TS, TU).
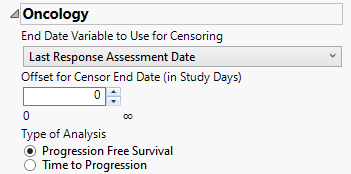
End Date Variable to Use for Censoring
For patients who survive progression-free beyond the end of the study, the ultimate progression-free survival values for these individuals are unknown. All that can be said is that progression-free survival exceeds the period of the study; these data are considered censored. For these cases, you must specify the end date for collecting data to assess progression. The End Date Variable to Use for Censoring widget is used to select which variable date reference from the demography domain to use for calculating the censored disease progression values. Patients who progress after this date are not considered as progressing. The Last Response Assessment Date is chosen by default.
Offset for Censor End Date (in Study Days)
The Offset for Censor End Date (in Study Days) option enables you to specify a minimum time interval following censor end date that can be used to determine whether progression has occurred. Patient who progress within that threshold are considered to have progressed whereas patients who progress after the specified threshold are not.
Type of Analysis
The Type of Analysis widgetenables you to specify whether you want to measure Progression Free Survival or Time to Progression. Progression free survival measures the time from patient randomization to either tumor progression or death. Time to progression censors death and only considers objective tumor progression. A note is added to the top of the report indication which type of analysis has been selected.
Advanced
Options in this category affect wide-ranging aspects of system and report behavior that are not specific to a domain class. These include column, display, sort, adjunct data path, definition, and scale preferences, among others.
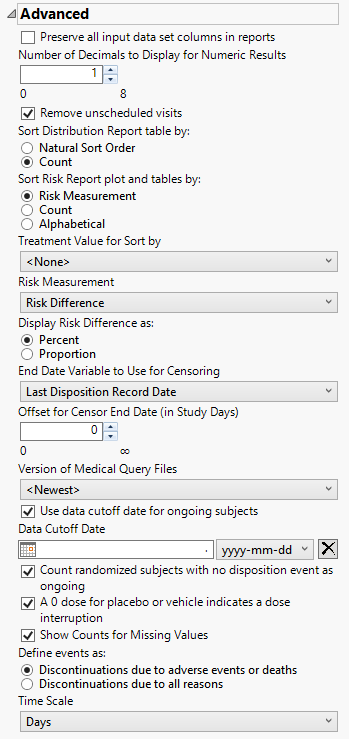
Preserve all input data set columns in reports
Check this box to include all input data columns in the output data table.
Number of Decimals to Display for Numeric Results
Use this option to specify the number of decimals to include in the plots and tables of numerical results.
Remove unscheduled visits
Check this option to remove unscheduled visits from the analysis. For a given Findings domain, any record where the VISIT variable (if it exists) contains unscheduled (case insensitive) is removed from the analysis.
Sort Distribution Report table by:
Use the Sort Distribution Report table by: widget to specify how the rows in the distribution reports table are to be sorted.
Sort Risk Report plot and tables by:
Use the Sort Risk Report plot and tables by: widget to specify how the rows in the Risk Report plot and tables are to be sorted..
Treatment Value for Sort by:
Use this widget to specify the treatment value to sort the plots and tables by. This is especially useful when there are multiple treatment regimes. Refer to Treatment Value for Sort by for more information.
Risk Measurement
Use the Risk Measurement drop-down menu to specify the risk measurement to use.
Display Risk Difference as:
Use this widget to specify the difference between the risk of an event in the treatment arm and the control arm as either a percentage or a proportion of the total subject population. This widget appears only when you select Risk Difference as the Risk Measurement.
End Date Variable for Censoring
Use the End Date Variable to Use for Censoring option for specifying the end date for censoring. Options include the reference end date, date of the last treatment, the date on which the subject left the study or the date of the last disposition record (selected by default).
Offset for Censor End Date (in Study Days)
Use this widget to specify the number of days to extend your analysis after the date specified using the End Date Variable for Censoring option.
Version of Medical Query Files
Use this widget to specify the version of the Medical Query files to use in the analysis. Options include all of the Medical Query files stored in the Medical Query directory specified for your configuration. Refer to /user Paths for information about the location of this directory.
Use data cutoff date for ongoing subjects
Check this box to use the date on which the study data was pulled for this report in place of exposure end date for ongoing subjects.
Data Cutoff Date
Use this option to specify the date on which the study data was pulled for this report. Refer to Data Cutoff Date for more information.
Count randomized subjects with no disposition event as ongoing
Check this box to count subjects who do not have a record in DS for either Completed or Discontinued as Ongoing for treatment and study status.
A 0 dose for placebo or vehicle indicates a dose interruption
Check this box if a dose of 0 for either the placebo or the vehicle indicates a dose interruption. When this box is unchecked, 0 doses is interpreted as a period where placebo or vehicle was given.
Show Counts for Missing Values
Check the box to add a row to summary statistics for the count of missing values.
Define events as:
Use this widget to specify those discontinuations that are to be considered as events. This option is used for records where the value in DSCAT is Disposition Event.and the last one (sorting by DSSTDTC) is selected (unless a where statement is defined to choose the records, 1 per person). Refer to Define events as: for more information.
Time Scale
Use this widget to specify the time scale to use for times. Options include Days, Weeks, Months, and Years. Refer to Time Scale for more information
Action Buttons
| 8 | Click to revert all study preferences to their default values. |
| 8 | Click to apply all changes to the study preferences. |
| 8 | Click to reject all changes and return study preferences to the previously saved state. |
Tips
Category disclosure states are saved, so Reset, OK, and Cancel apply to those states as well.
To view or edit multiple studies' preferences simultaneously, select at least two studies and click Set Study Preferences. This might be useful if a configuration-wide reset of study preferences is desired.
Where possible, study preferences propagate through study management operations (e.g., Refresh Study Metadata, Update Study with New Snapshot) or are otherwise updated to applicable defaults.