Demographics Distribution
This report displays the Demographic characteristics for a clinical study. It accomplishes this using both a graphical histogram display (Demographic Details) and a tabular display (Demographic Tables). Optionally, but not by default, it can display statistical comparisons as well.
Report Description
Running this report with the Nicardipine sample setting using the default options generates the output shown below.
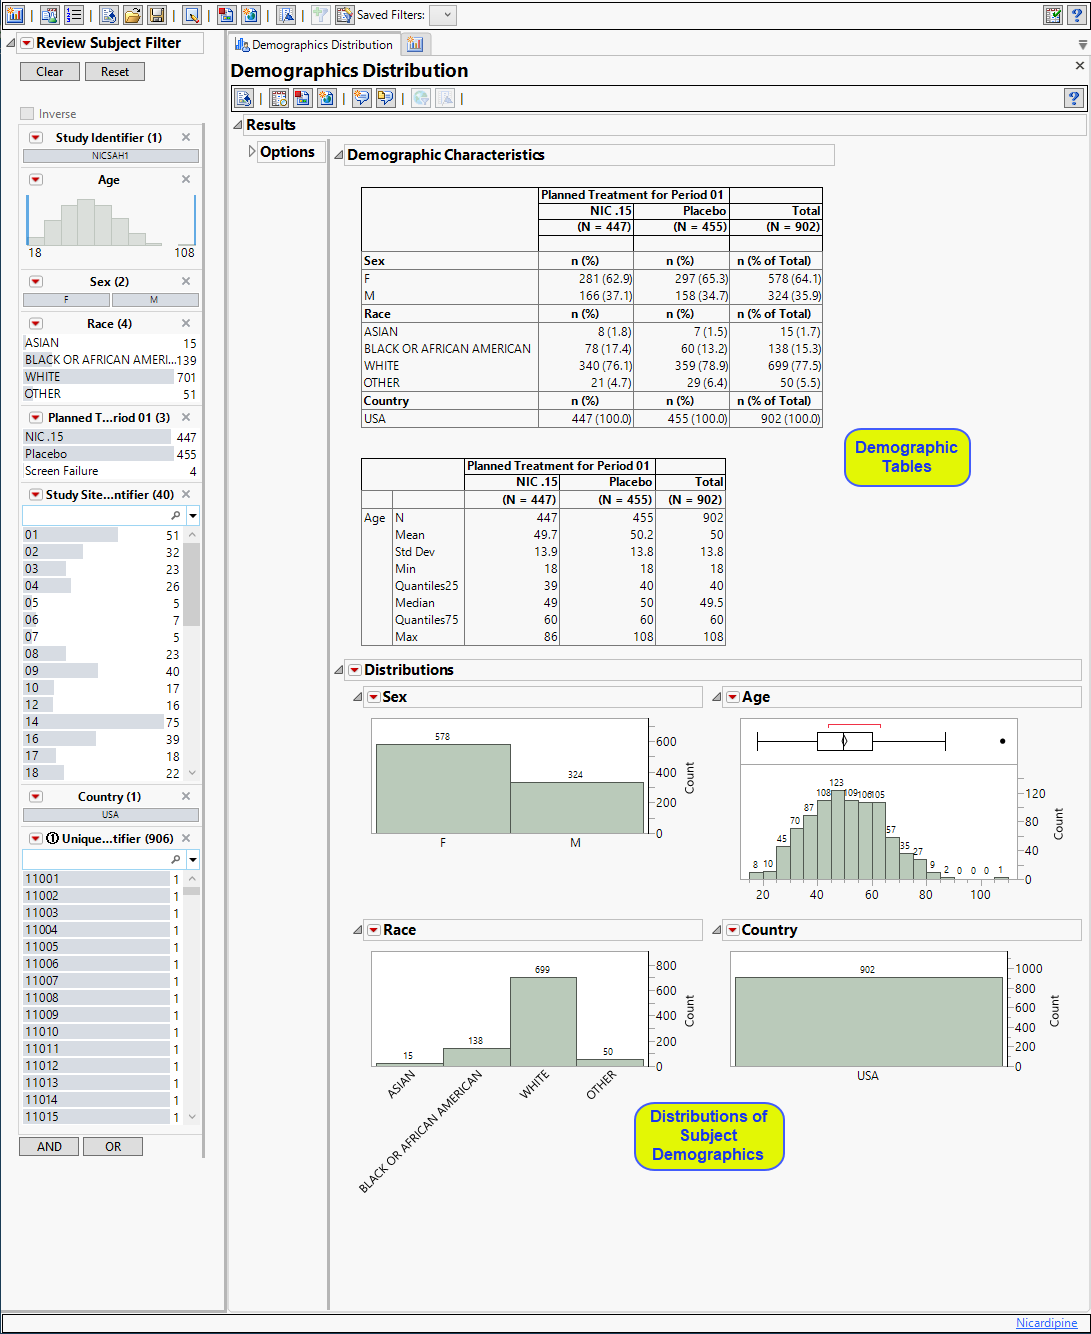
The Demographics Distribution report initially shows two sections Demographic Characteristics and Distributions.
Demographics Characteristics
Presents histograms for available demographic characteristics such as age, treatment, sex, race, ethnicity, and Study Site Identifier, by default. Click  in the Optionspanel to add additional histograms.
This section contains the following elements:
| • | One or more Histograms. |
The height (or length) of each bar is an indication of the number of subjects exhibiting each demographic characteristic.
You can change how your data are presented in the histograms uing the Histogram Options, which can be viewed by clicking  for each set of histograms and selecting Display Options.
Quantiles and summary statistics are provided for continuous variables like Age, and frequencies are provided for categorical variables like Sex. These can be viewed by clicking for each set of histograms and selecting Display Options.
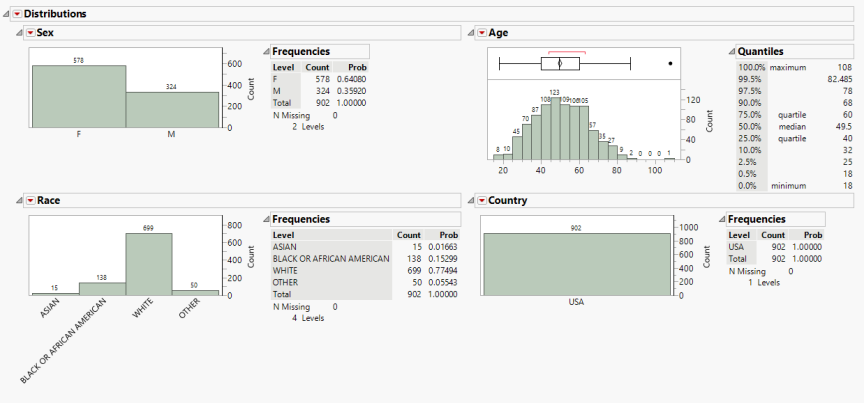
See Distribution for more information.
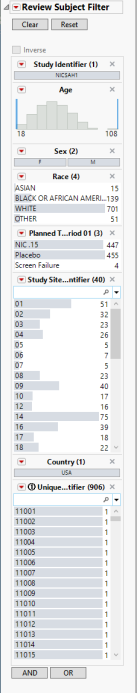
Report Subject Filters
These filters enable you to subset and view subjects based on demographic characteristics and other criteria. Refer to Data Filter for more information.
Treatment Comparisons
This report performs aone-way ANOVA (analysis of variance) to detect statistical differences for continuous demographic variables (e.g. Age) and contingency analyses for character/categorical variables (e.g. sex, race, and study site) by the treatment variable specified in the Optionspanel.
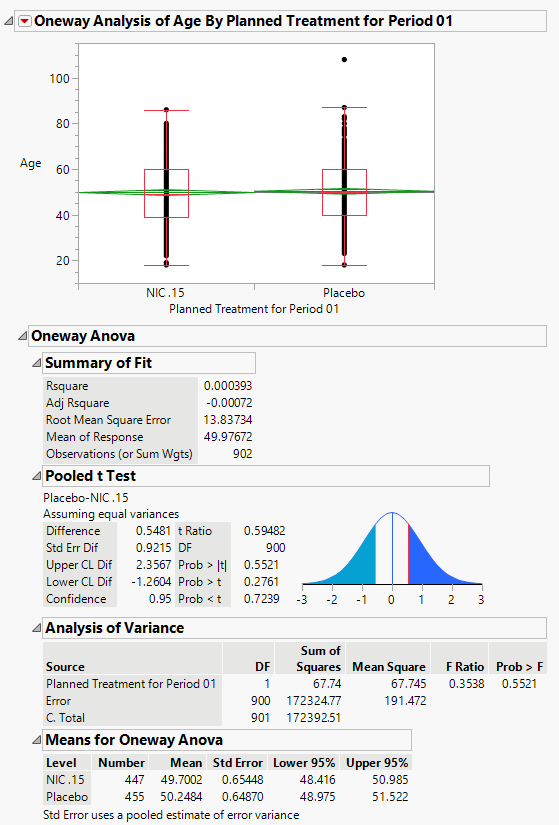
The One-way Plot above shows the distribution subjects by age for each of the two treatment arms. The analysis statistics are listed in the tables below the plot.
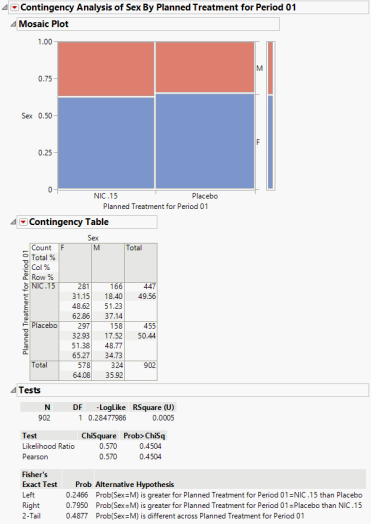
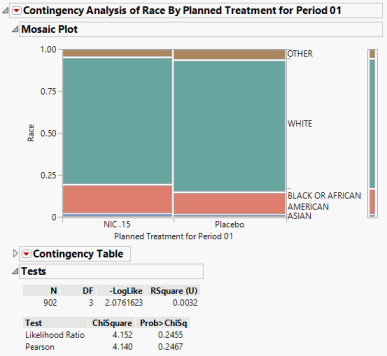
The Mosaic Plots for sex and race by treatment arm are graphical representation of a two-way frequency table or contingency table (shown below their respective plots) , divided into colored rectangles. There is one rectangle for each demographic group for each treatment arm. The area of each rectangle is proportional to the proportions of each demographic group in each treatment arm.
Options
This panel enables you to select the demographic variables used to create distributions, specify the number of decimal places to display and perform treatment comparison analysis for the demographic groups.
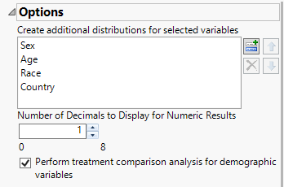
Create additional distributions for selected variables
This option enables you to add or remove demographic variables from DM from the distributions.
| 8 | Click  to open the Add window shown below: to open the Add window shown below: |
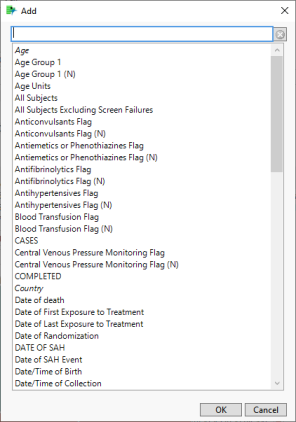
| 8 | Select one or more variables and click |
| 8 | To remove one or more distributions, highlight the variables to be deleted and click  . . |
| 8 | To rearrange the order of the distributions, select a variable and click either  or or  . . |
Number of Decimals to Display for Numeric Results
Use this option to specify the number of decimals to include in the plats and tables of numerical results.
Perform treatment comparison analysis for demographic variables.
Check this box to generate the treatment comparisons shown above.
General and Drill Down Buttons
Action buttons, provide you with an easy way to drill down into your data. The following action buttons are generated by this report:
| • | Click  to rerun the report using default settings. to rerun the report using default settings. |
| • | Click  to view the associated data tables. Refer to Show Tables/View Data for more information. to view the associated data tables. Refer to Show Tables/View Data for more information. |
| • | Click  to generate a standardized pdf- or rtf-formatted report containing the plots and charts of selected sections. to generate a standardized pdf- or rtf-formatted report containing the plots and charts of selected sections. |
| • | Click  to generate a JMP Live report. Refer to Create Live Report for more information. to generate a JMP Live report. Refer to Create Live Report for more information. |
| • | Click  to take notes, and store them in a central location. Refer to Add Notes for more information. to take notes, and store them in a central location. Refer to Add Notes for more information. |
| • | Click  to read user-generated notes. Refer to View Notes for more information. to read user-generated notes. Refer to View Notes for more information. |
| • | Click  to open and view the Subject Explorer/Review Subject Filter. to open and view the Subject Explorer/Review Subject Filter. |
| • | Click  to specify Derived Population Flags that enable you to divided the subject population into two distinct groups based on whether they meet very specific criteria. to specify Derived Population Flags that enable you to divided the subject population into two distinct groups based on whether they meet very specific criteria. |
Default Settings
Refer to Set Study Preferences for default Subject Level settings.
Methodology
No testing is performed. Analysis is restricted to tabulating counts/percentages of subjects' demographic data.