Medical Query Risk Report
This process screens medical query terms by performing Cochran-Mantel-Haenszel (CMH) tests on all 2 x 2 tables constructed from event incidence and treatment arm. Output is a two-sided plot with a dot plot showing percent occurrence and forest plot showing risk measurement. Additionally there are 4 tables for narrow queries with dictionary-derived terms , broad queries with dictionary-derived terms, broad and narrow queries, and queries by System Organ Class (SOC).
Report Results Description
Running Medical Query Risk Report for the Nicardipine study using MedDRA Version 16.0 files, the planned treatment ARM, and narrow search queries, generates the Report shown below.
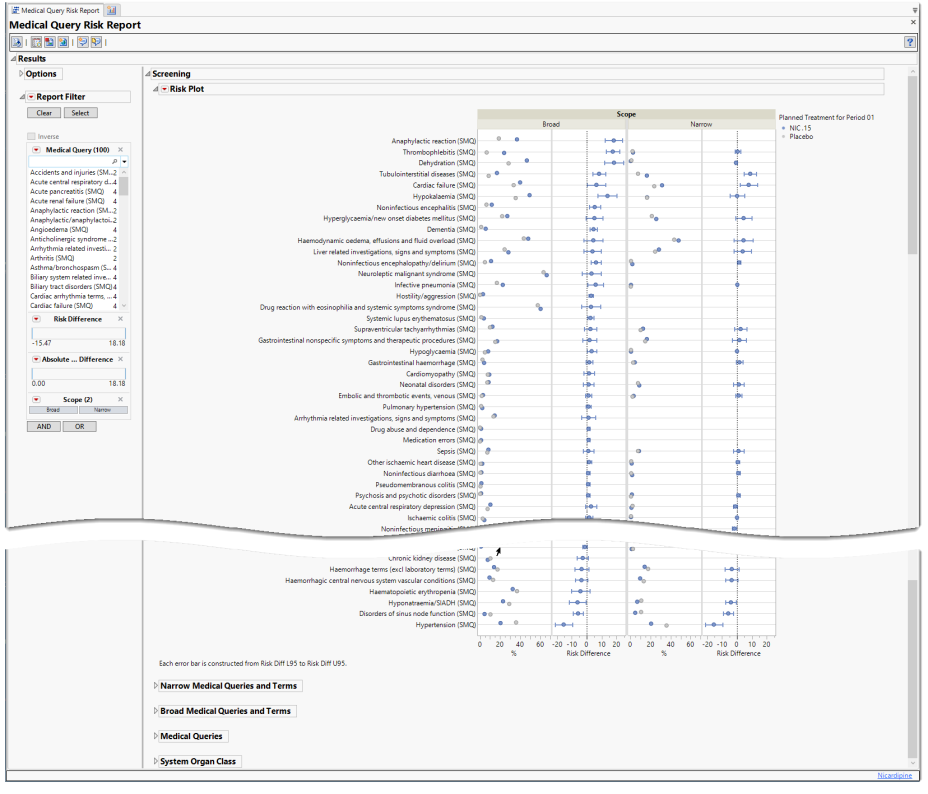
The Report contains the following elements:
Plots
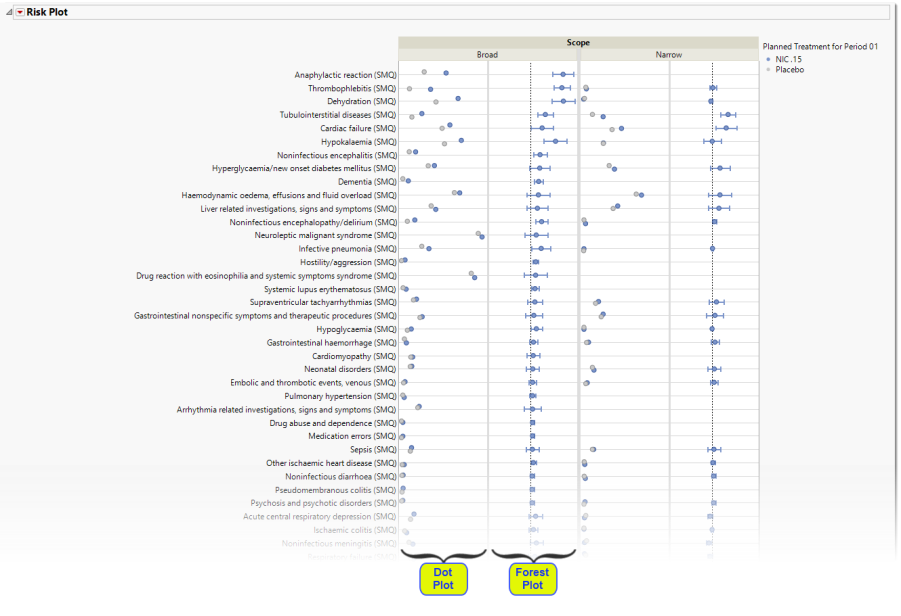
There are four plots shown here: a group of two plots for broad scope queries and a group of two plots for narrow scope queries. Medical queries are shown on the y axis. The dot plot on the left of each group shows the percentile occurrence of subjects in each arm exhibiting the queries. The Forest plot on the right of each group shows the risk difference for subjects to exhibit events covered by each query.
Forest Plots display relative strength of treatment effects as horizontal lines representing the 95% confidence interval of the effect observed in that trial. The confidence interval is normally for the relative likelihood of a given nominal-level outcome for the intervention group compared to the control group. In this example, the forest plot shown below, represents the risk difference for developing the specified event relative to exposure to Nicardipine.
Tables
Four tables were generated for this example.
Narrow Medical Queries and Terms
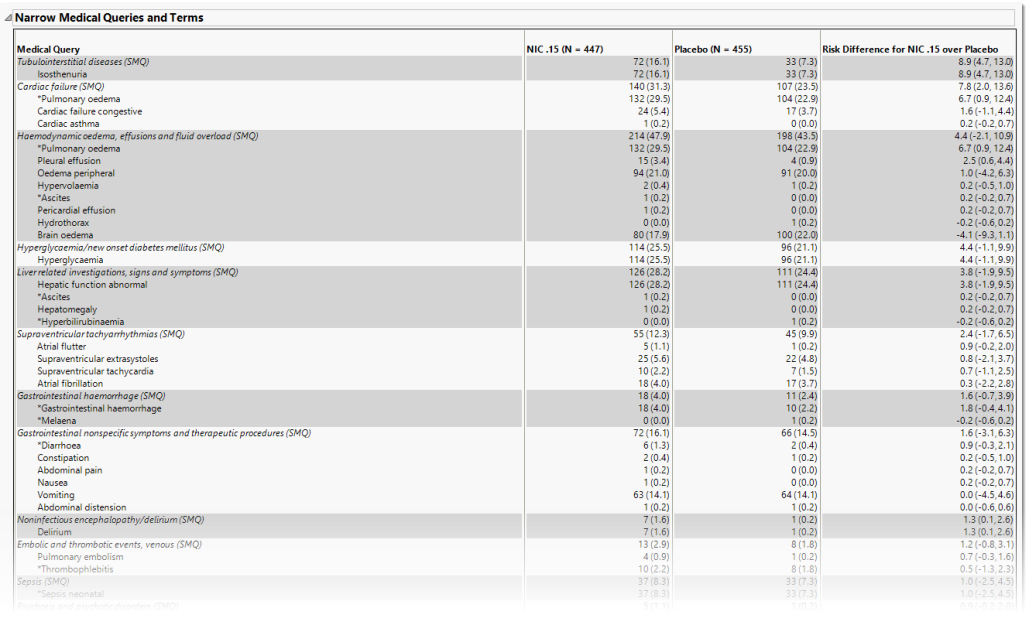
This table lists each narrow query with its associated dictionary-derived terms, the number (percentile) of subjects exhibiting the event, and the risk difference between the treatment arms.
Broad Medical Queries and Terms
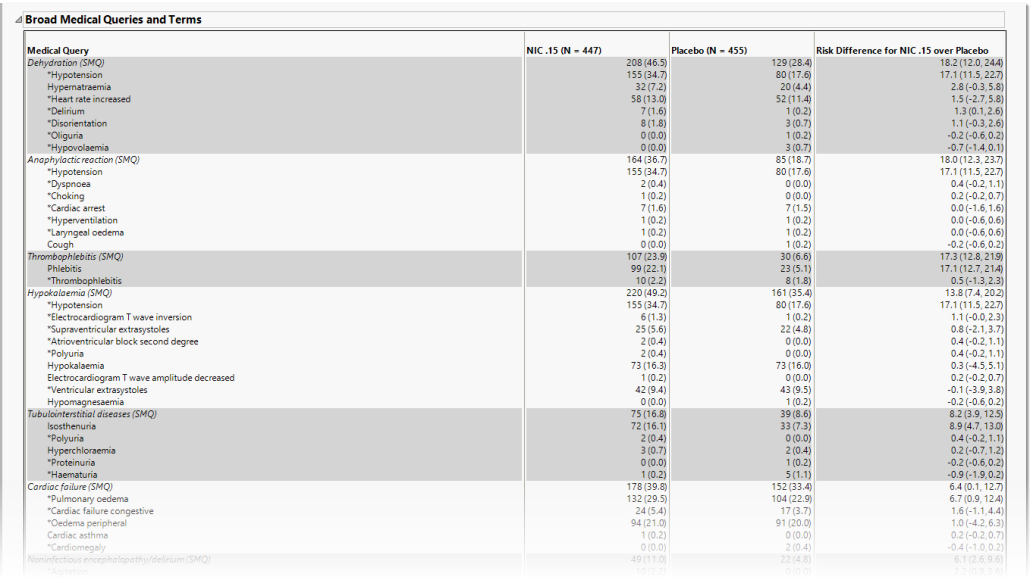
This table lists each broad query with its associated dictionary-derived terms, the number (percentile) of subjects exhibiting the event, and the risk difference between the treatment arms.
Medical Queries
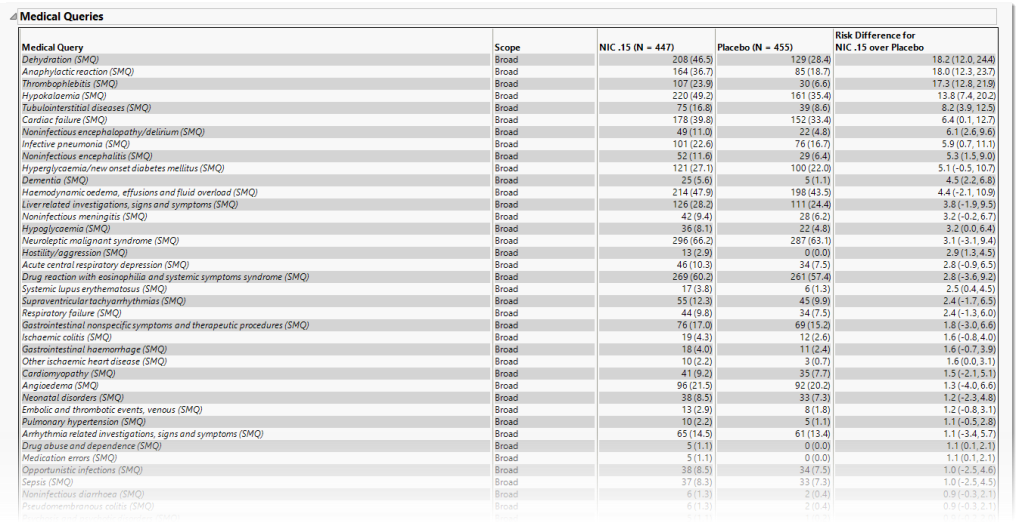
This table summarizes each query without the associated dictionary-derived terms for the number (percentile) of subjects exhibiting the event, and the risk difference between the treatment arms.
System Organ Class
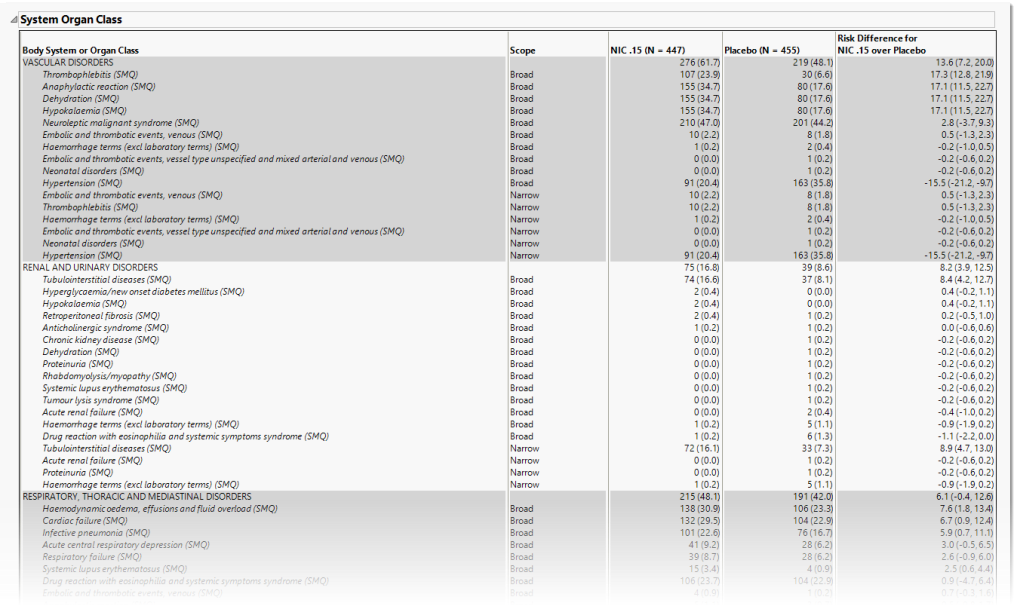
This table lists the number (percentile) of subjects exhibiting each SOCand the risk difference between the treatment arms.
Options
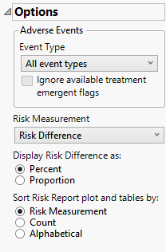
Event Type
Analysis can consider all events or only those that emerge at specific times before, during, or after the trial period. For example, selecting On treatment events as the Event Type includes only those events that occur on or after the first dose of study drug and at or before the last dose of drug (+ the offset for end of dosing).
Ignore available treatment emergent flags
If you choose to Ignore available treatment emergent flags, the analysis includes all adverse events that occur on or after day 1 of the study when the event type is Treatment emergent events.
Risk Measurement
Use the Risk Measurement, option to specify the measure you want to use for defining risk.
Display Risk Difference as:
Use this widget to specify whether to display the risk difference values as either percentages or proportions.
Sort Risk Report plot and tables by:
**need verbiage
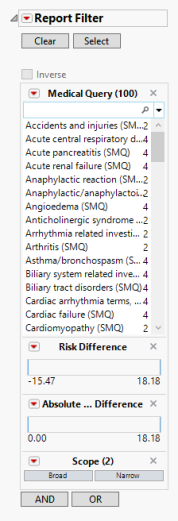
Report Data Filters
These filters enable you to subset and view subjects based on demographic characteristics and other criteria. Refer to Data Filter for more information.
General and Drill Down Buttons
Action buttons, provide you with an easy way to drill down into your data. The following action buttons are generated by this report:
| • | Click  to rerun the report using default settings. to rerun the report using default settings. |
| • | Click  to view the associated data tables. Refer to Show Tables/View Data for more information. to view the associated data tables. Refer to Show Tables/View Data for more information. |
| • | Click  to generate a standardized pdf- or rtf-formatted report containing the plots and charts of selected sections. to generate a standardized pdf- or rtf-formatted report containing the plots and charts of selected sections. |
| • | Click  to generate a JMP Live report. Refer to Create Live Report for more information. to generate a JMP Live report. Refer to Create Live Report for more information. |
| • | Click  to take notes, and store them in a central location. Refer to Add Notes for more information. to take notes, and store them in a central location. Refer to Add Notes for more information. |
| • | Click  to read user-generated notes. Refer to View Notes for more information. to read user-generated notes. Refer to View Notes for more information. |
Default Settings
Refer to Set Study Preferences for default Subject Level settings.
Methodology
To run this report, at least two treatment levels are needed and the treatment control level preference must not be set to None.