Drug-induced Liver Injury
This report assesses the results of multiple lab tests enabling you to determine whether trial subjects have sustained drug-induced liver damage. Analysis results are presented and summarized in multiple graphs and tables.
Report Results Description
Running this report with the Nicardipine sample setting generates the report shown below.
The Report contains the following elements:
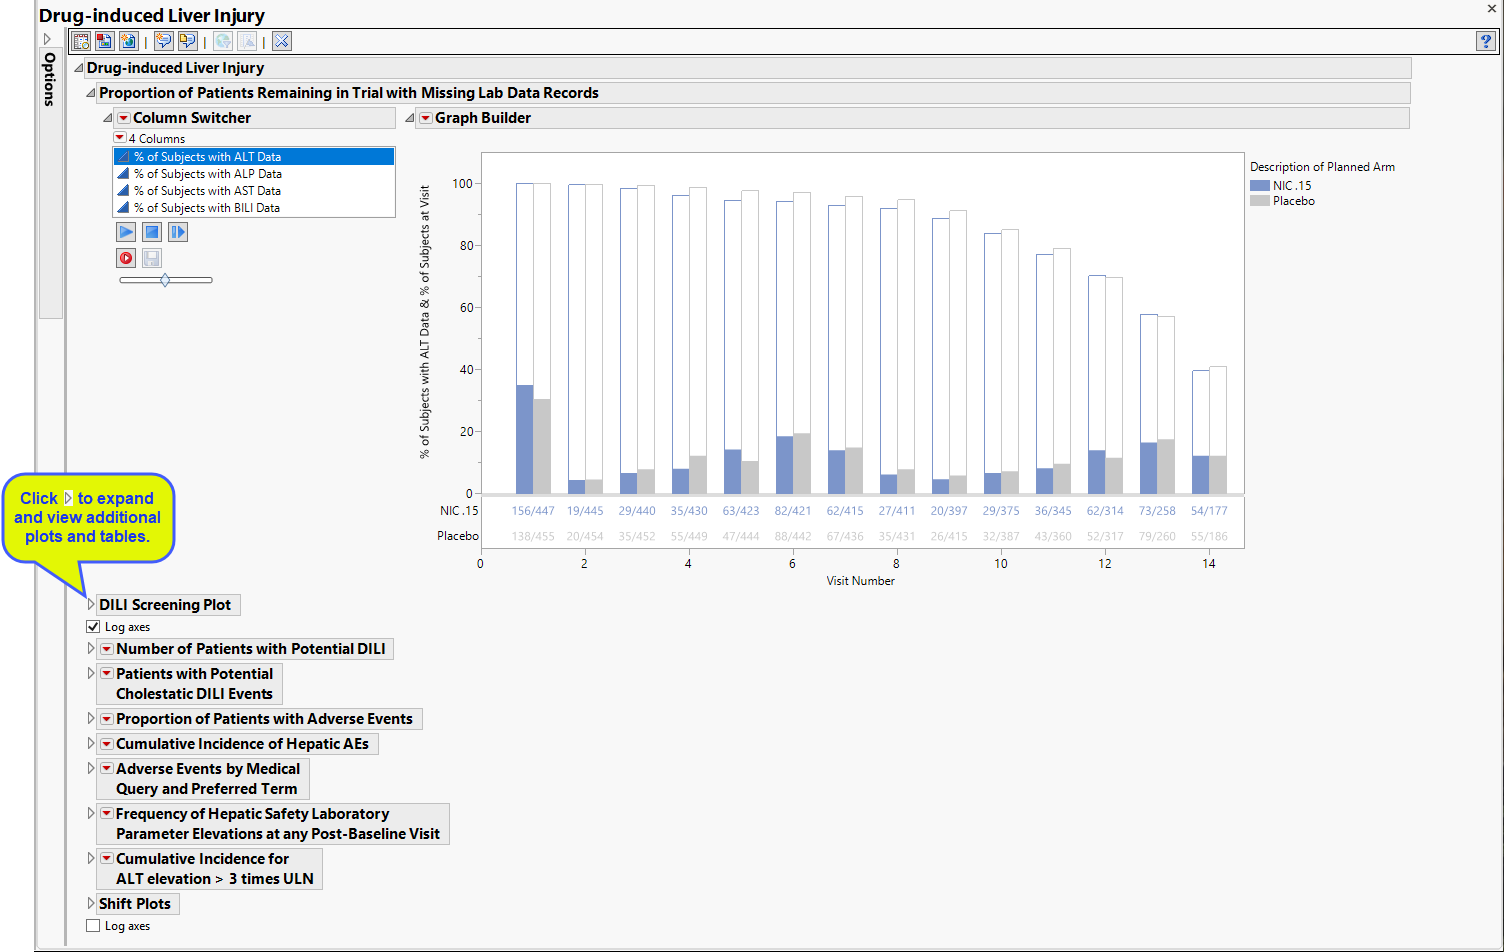
Proportion of Patients Remaining in Trial with Missing Lab Data Records
Contains 4 stacked Bar Charts showing the percent of subjects at each visit who either had relevant labs (filled bars) or were missing those tests (unfilled bars).
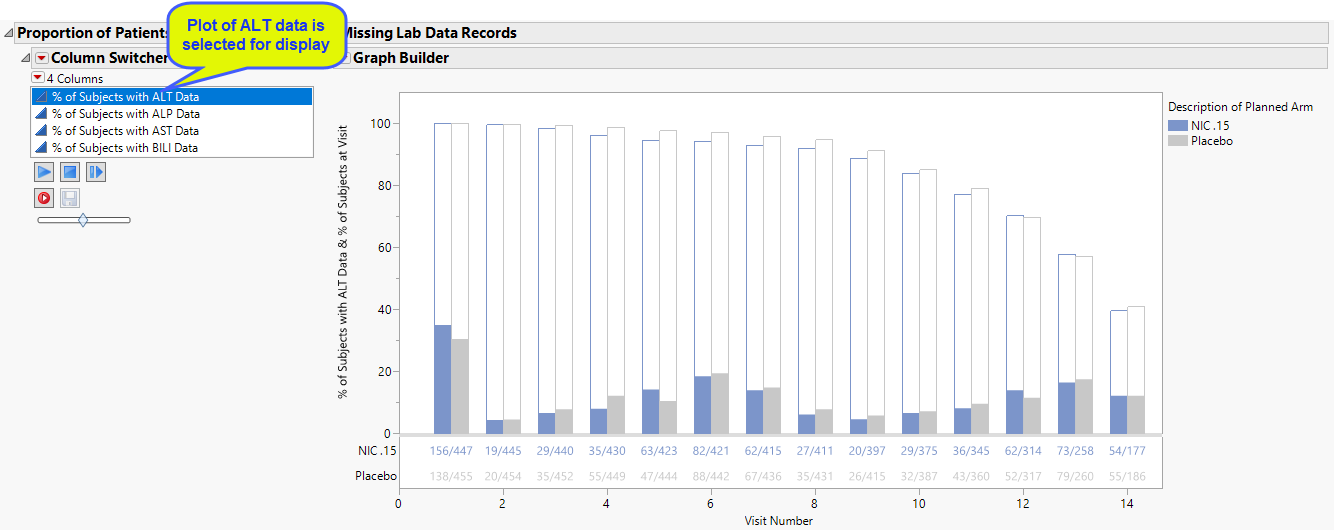
The plot of subjects with and without alanine aminotransferase (ALT) test data has been selected and displayed. The Column Switcher enables you to choose among four different plots. Use the Column Switcher to select this plot or plots of subjects with/without alkaline phosphatase (ALP), aspartate aminotransferase (AST), or bikirubin (BILI) data.
The percentage of subjects with test data at each visit is shown by the filled bars. The relative number for this group is shown below the plot. There is a separate bar for each treatment arm. The percentage of subjects missing the test data is shown by the empty bar stack atop the filled bar. The total height of the stacked bar pair indicates the percentage of subjects for each arm present at the visit.
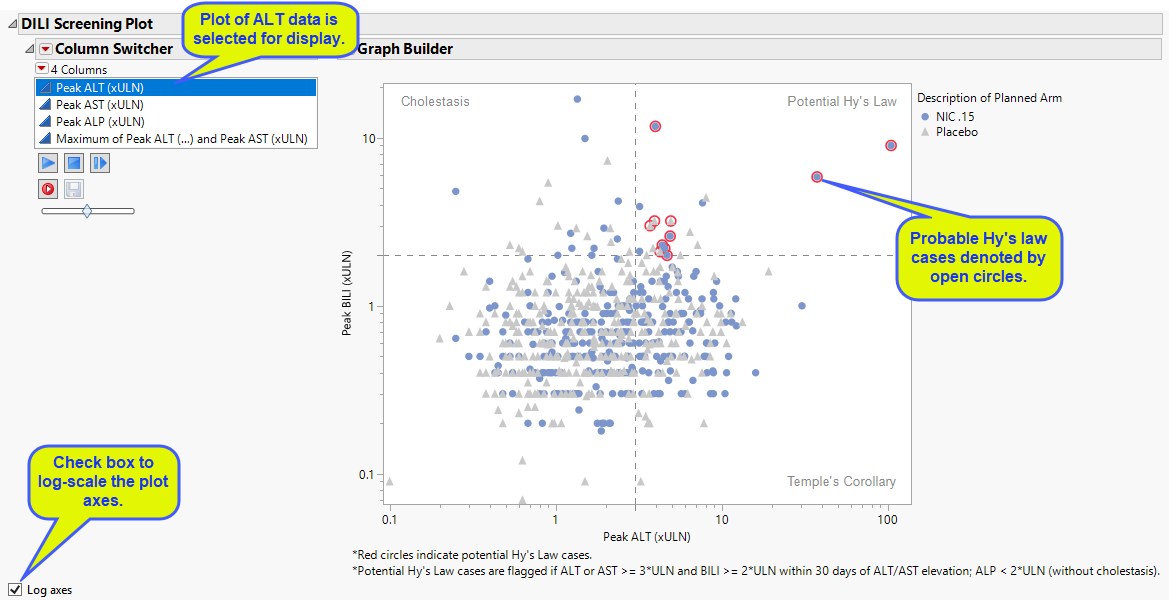
DILI Screening Plot
Displays an overall scatter plot of peak ALT, AST , BILI, and ALP measurements across the study, with color used to indicate treatment arm.
The Peak Liver Test Results section consists of the following elements:
| • | One Overlay Plot of Hy's Law Lab Tests. |
This plot shows maximum laboratory values for the Alanine Aminotransferase (ALT), laboratory test (x-axis). Use the column switcher to view results for the Aspartate Aminotransferase (AST) and Alkaline Phosphatase (ALP) laboratory tests. The test for Total Bilirubin (BILI) is always shown on the y-axis, regardless of the column switcher selection. The values are log2 transformed (this can be changed to log10 or no transformation in the report dialog) and normalized by the Upper Limit of Normal (LBSTNRHI). Subjects are colored and marked by treatment arm. Reference lines are drawn by default at 3*ULN for ALT and AST and 2*ULN for BILI and ALP. These reference limits can be customized on the dialog. Subjects are colored by treatment group. Additional information is listed below the plot.
These limits are also used to create the Hy's Law indicator flag. Subjects with a test value exceeding 3*ULN for ALT or AST (signs of hepatocellular injury) accompanied or followed by elevation of 2*ULN or greater for the BILI test have a "Yes" value for the Hy's Law Case variable created. You can change the number of days following ALT/AST elevation for which to look for BILI elevation to flag possible Hy's Law cases on the report dialog. You can choose to label the quadrants of Hy's Law (Cholestasis, Hy's Law, and Temple's Corollary) in the scatterplot through a check box option on the dialog.
You can choose whether to set the axis to normal or log scale using the check box.
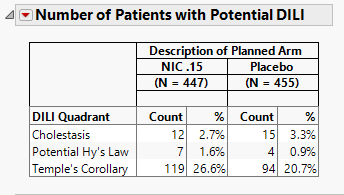
Number of Patients with Potential DILI
The table shown is this section summarizes the results shown in the Peak Liver Test Results plot.
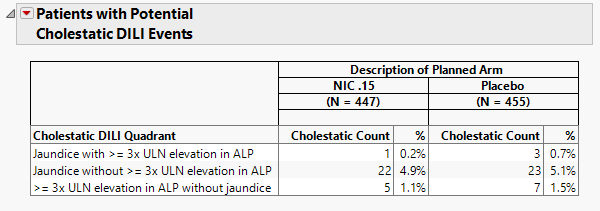
Patients with Potential Cholestatic DILI Events
The table shown in this section summarizes the patients showing evidence (high bilirubin and/or alkaline phosphatase) of cholestatic liver injury from the Peak Liver Test Results plot above.
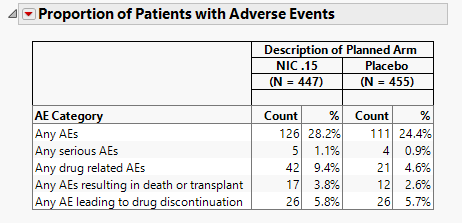
Proportion of Patients with Adverse Events
The table shown in this section summarizes adverse events suffered by patients in both treatment arms.
Cumulative Incidence of Hepatic AEs
The plot in this section shows the cumulative incidence of liver-related adverse events for subjects in each treatment arm over the course of the treatment regime. It includes both unique as well as recurrent incidences.
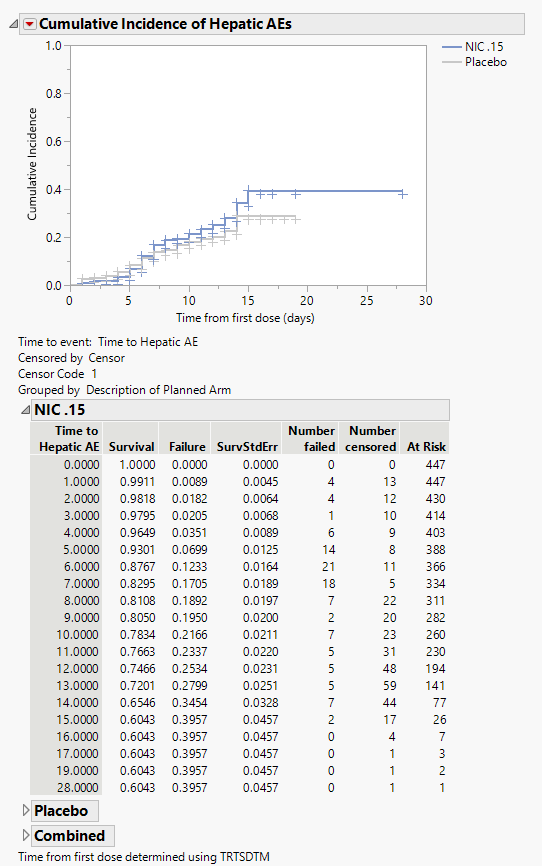
The tables summarize by day the number of patients either failing or being censored. Tables show either combined results or results divided by treatment arm.
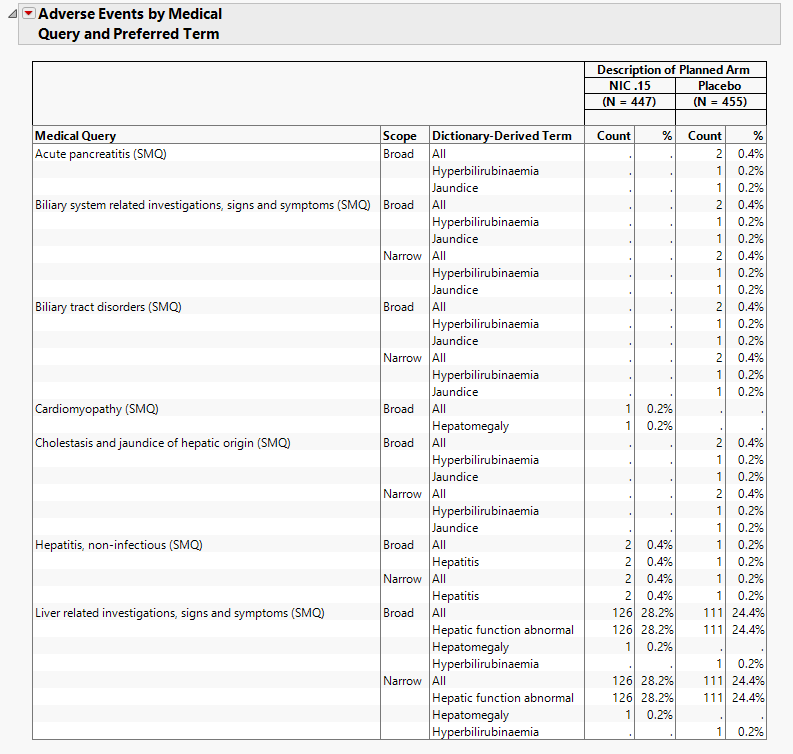
Adverse Events by Medical Query and Preferred Term
The table in this section summarizes patient adverse events by medical query and preferred term for patients in each treatment arm.
Frequency of Hepatic Safety Laboratory Parameter Elevations at any Post-Baseline Visit
Contains tables corresponding to AT Test Elevation and potential Hy's Law cases, as well as counts and percentages for elevation categories for each liver test.
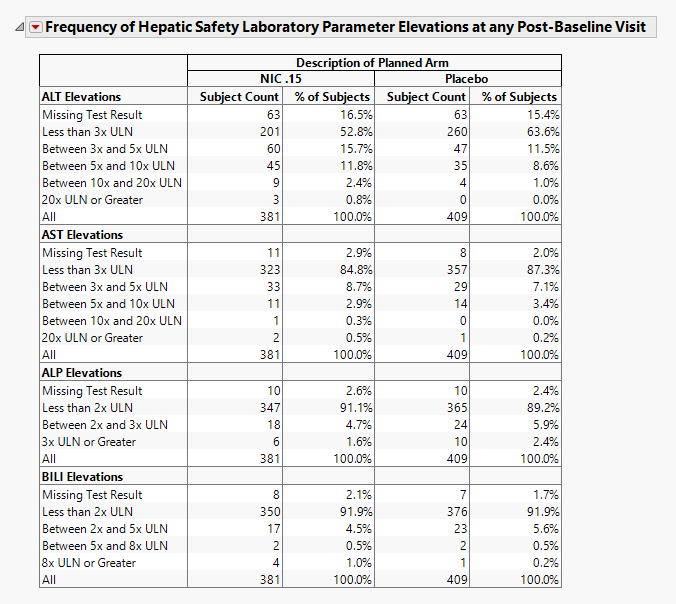
It contains the following elements:
| • | A table of Counts and Percents for elevation categories for each liver test. |
All tables are associated with the Local Data Filter (located on the right side). You can use this filter to subset the tables based on variable filters. You can select cells of these tables (either counts or percents) to select the corresponding rows in the data table.
Results for the various tests are sorted into rows as described in the following tables:
| For ALT and AST | |
|---|---|
|
Row |
Contains subjects who show results that are: |
|
Missing Test Result |
See below. |
|
Less than 3x ULN |
less than 3x the upper limit of normal (ULN) |
|
Between 3x and 5x ULN |
inclusive of greater than or equal to 3x ULN and less than 5x ULN |
|
Between 5x and 10x ULN |
inclusive of greater than or equal to 5x ULN and less than 10x ULN |
|
Between 10x and 20x ULN |
inclusive of greater than or equal to 10x ULN and less than 20x ULN |
| 20x ULN or Greater | inclusive of equal to or greater then 20x ULN |
| For ALP | |
|---|---|
|
Row |
Contains subjects who show results that are: |
|
Missing Test Result |
See below. |
|
Less than 2x ULN |
less than 2x the upper limit of normal (ULN) |
|
Between 2x and 3x ULN |
inclusive of greater than or equal to 2x ULN and less than 3x ULN |
|
3x ULN or Greater |
equal to or greater then 3x ULN |
| For BILI | |
|---|---|
|
Row |
Contains subjects who show results that are: |
|
Missing Test Result |
See below. |
|
Less than 2x ULN |
less than 2x the upper limit of normal (ULN) |
|
Between 2x and 5x ULN |
inclusive of greater than or equal to 2x ULN and less than 5x ULN |
|
Between 5x and 8x ULN |
inclusive of greater than or equal to 5x ULN and less than 8x ULN |
| 8x ULN or Greater | all equal to or greater then 8x ULN |
| For Gamma-Glutamyl Transferase | |
|---|---|
|
Row |
Contains subjects who show results that are: |
|
Missing Test Result |
See below. |
|
Less than 2x ULN |
less than 2x the upper limit of normal (ULN) |
|
2x ULN or Greater |
equal to or greater then 2x ULN |
| For INR | |
|---|---|
|
Row |
Contains subjects who show results that are: |
|
Missing Test Result |
See below. |
|
Less than 1.5x ULN |
less than 1.5x the upper limit of normal (ULN) |
|
Between 1.5x and 3x ULN |
inclusive of greater than or equal to 1.5x ULN and less than 3x ULN |
|
Between 3x and 5x ULN |
inclusive of greater than or equal to 3x ULN and less than 5x ULN |
|
5x ULN or Greater |
equal to or greater then 5x ULN |
Note: Thresholds for ALT/AST and BILI/ALP are set based on guidelines from USDHHS, FDA and CDER (https://www.fda.gov/media/71665/download).
Missing Test Result is calculated as count (and percent) of subjects who had no record of a specific test (there is no row in the lb data set for the respective LBTEST for the subject) at any day of the study, have no nonmissing measurement(s) for the recorded test (LBSTRESN is a missing value), or are missing the upper limit of normal reference limit (LBSTNRHI is a missing value).
Important: The counts and percentages for Missing Test Result on this section are calculated out of all subjects that have at least one nonmissing result for at least one of the liver lab tests. The counts shown on the Drug-induced Liver Injury section include subjects that had no record or were missing all values for all four liver lab tests.
Note: These tables are derived from the same data table that the Drug-induced Liver Injury, Drug-induced Liver Injury, and Drug-induced Liver Injury sections are derived from, so any selections that you make are reflected across those tabs.
You can run downs off of table cell selections for an additional level of dynamic exploration.
Cumulative Incidence for ALT Elevation > 3 times ULN
The plot in this section shows the cumulative incidence of ALT elevation above 38ULN for subjects in each treatment arm over the course of the treatment regime. It includes both unique as well as recurrent incidences.
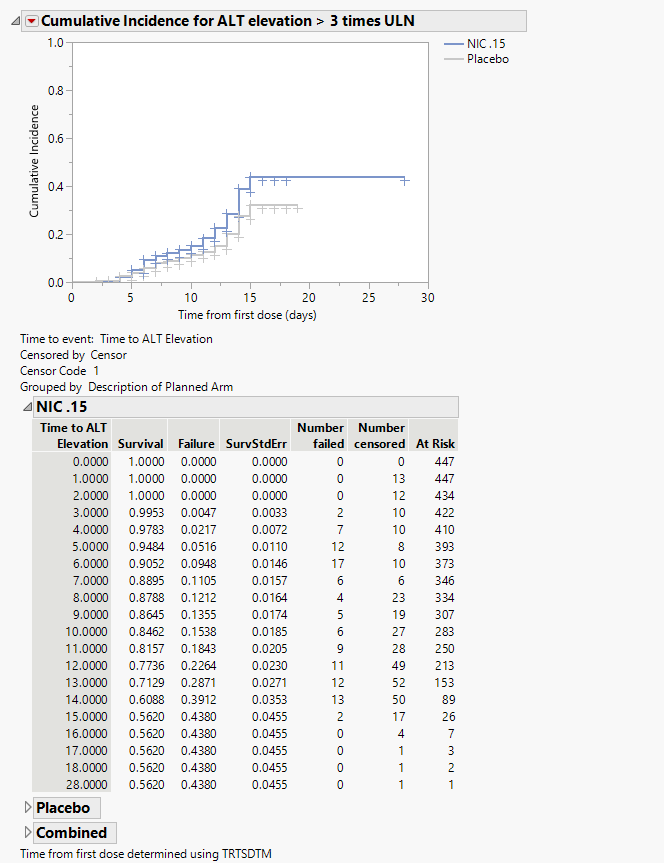
The tables summarize by day the number of patients either failing or being censored. Tables show either combined results or results divided by treatment arm.
Shift Plots
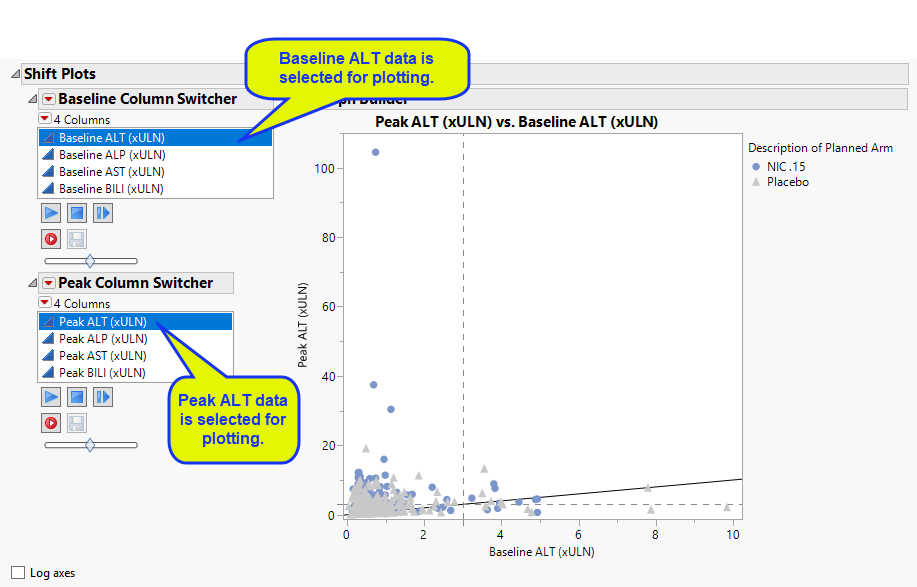
These plots show how findings levels change from baseline values as a result of treatment. Blue points represent patients treated with nicardipine. Gray points represent patients receiving the placebo. The approximately square spread of points (with a diagonal line splitting approximately even across it) indicates similar variability of measurements before and after treatment.
Use the Column Switchers to select this plot (ALT) or plots of subjects with/without alkaline phosphatase (ALP), aspartate aminotransferase (AST), or bikirubin (BILI) data. Findings data selected in the Baseline Column Switcher are plotted on the x-axis, findings data selected in the Peak Column Switcher are displayed on the y-axis. Subjects falling above the reference line should be investigated for liver injury; the higher the ratio of peak to baseline value, the greater likelihood of damage
You can choose whether to set the axis to normal or log scale using the check box.
General
| • | Click  to view the associated data tables. Refer to Show Tables/View Data for more information. to view the associated data tables. Refer to Show Tables/View Data for more information. |
| • | Click  to generate a standardized pdf- or rtf-formatted report containing the plots and charts of selected sections. to generate a standardized pdf- or rtf-formatted report containing the plots and charts of selected sections. |
| • | Click  to generate a JMP Live report. Refer to Create Live Report for more information. to generate a JMP Live report. Refer to Create Live Report for more information. |
| • | Click  to take notes, and store them in a central location. Refer to Add Notes for more information. to take notes, and store them in a central location. Refer to Add Notes for more information. |
| • | Click  to read user-generated notes. Refer to View Notes for more information. to read user-generated notes. Refer to View Notes for more information. |
| • | Click  to open and view the Subject Explorer/Review Subject Filter. to open and view the Subject Explorer/Review Subject Filter. |
| • | Click  to specify Derived Population Flags that enable you to divided the subject population into two distinct groups based on whether they meet very specific criteria. to specify Derived Population Flags that enable you to divided the subject population into two distinct groups based on whether they meet very specific criteria. |
| • | Click the arrow to reopen the completed report dialog used to generate this output. |
| • | Click the gray border to the left of the Options tab to open a dynamic report navigator that lists all of the reports in the review. Refer to Report Navigator for more information. |
Report Options
This report requires lab results for bilirubin, alanine aminotransferase, aspartate aminotransferase, and alkaline phosphatase. At least one of the standardized short name character strings listed in the following table must be present in the LBTESTCD column for each lab result.
|
Lab Test1: |
Required String: |
|
Bilirubin |
Either BILI or TBIL Note: If neitherBILInorTBILare found, the report searches for and usesTBILI,TBL,BILT,BILTOT,andBIL(in that order). |
|
Alanine Aminotransferase |
Either ALT, ALAT, or SGPT |
|
Aspartate Aminotransferase |
Either AST, ASAT, or SGOT |
|
Alkaline Phosphatase |
Either ALP or ALKP Note: If neither ALP nor ALKP are found, the report searches for and uses ALK and APH, in that order. |
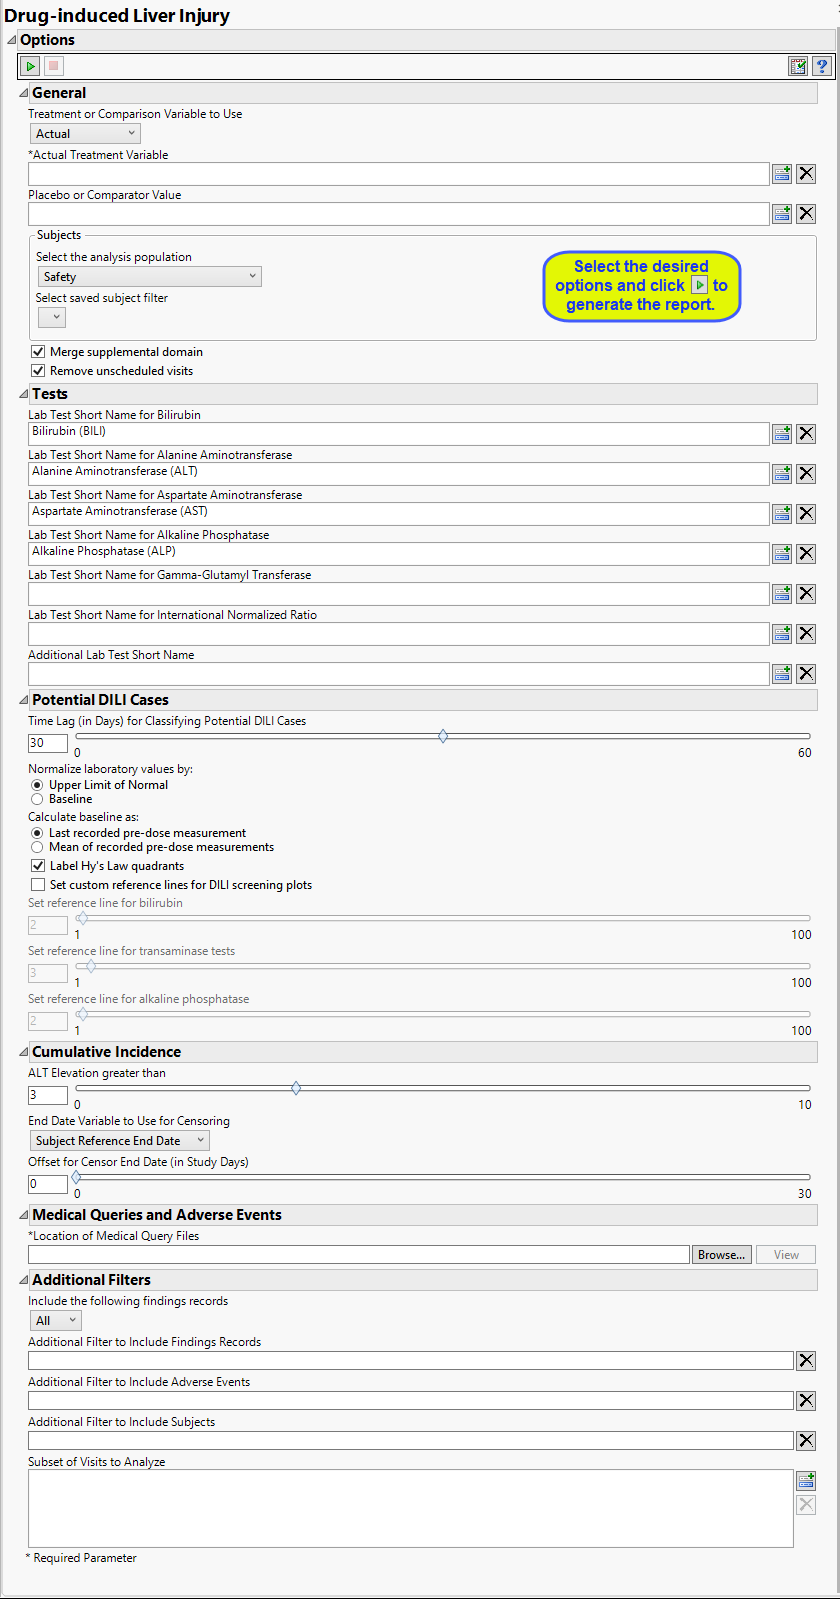
Setting Up Treatment or Comparison Variable:
Treatments are defined by specific values in the treatment or comparison variables of the CDISC models. These variables are specified in this report using the Treatment or Comparison Variable to Use, Actual/Planned/Comparison Variable, and Placebo or Comparator Variable options. Available variables include Planned, which is selected when the treatments patients received exactly match what was planned and Actual, which is selected when treatment deviates from what was planned. Alternatively, you can select Defined Below to specify a single comparison variable. The Placebo or Comparator Variable option is used for comparison to either the actual or planned treatment variables. This option is available only when either Planned or Actual is selected as the Treatment or Comparison Variable to Use.
Filtering the Data:
Filters enable you to restrict the analysis to a specific subset of subjects and/or findings records, based on values within variables. You can also filter based on population flags (Safety is selected by default) within the study data.
If there is a supplemental domain (SUPPXX) associated with your study, you can opt to merge the non-standard data contained therein into your data.
See Select the analysis population, Select saved subject filter2, Merge supplemental domain, for more information.
You can restrict the analysis to data from scheduled visits by checking the Remove unscheduled visits box.
Tests
Use this text fields to specify the Test Short Name (LBTESTCD ) value that corresponds to each of the tests associated with Hy’s Law screening. These include tests for bilirubin, alanine aminotransferase, aspartate aminotransferase, alkaline phosphatase, gamma-glutamyl transferase, as well as additional tests you may specify. These options are enable you to specify individual tests when non-standard test names are used in the study. If these options are left blank, JMP Clinical uses the standard test designations.
See Lab Test Short Name for Bilirubin, Lab Test Short Name for Alanine Aminotransferase, Lab Test Short Name for Aspartate Aminotransferase, Lab Test Short Name for Alkaline Phosphatase, Lab Test Short Name for Gamma-Glutamyl Transferase, Lab Test Short Name for International Normalized Ratio, and Additional Lab Test Short Name.
Potential DILI Cases
Use the Time Lag (in Days) for Classifying Hy’s Law Cases option to specify the allowed interval between transaminase and bilirububin measurements for a patient to be considered a Hy’s Law case. The default value of 0 days indicates that a subject is a Hy’s Law case if Transaminase measurements (ALT or AST) exceed 3 times the upper limit of normal (3*ULN) and Total Bilirubin measurements exceed twice the specified ULN (2*ULN) from tests taken on the same study day. Alternatively, a time lag can be set to x number of days to classify a subject as a Hy's Law Case if Total Bilirubin exceeds 2*ULN within x days after ALT or AST exceeds 3*ULN.
For example, this value can be set to 30 in order to flag subjects as Hy's Law cases if a subject has BILI >= 2*ULN at any time within a month after elevated Transaminase measurements above 3*ULN.
Selecting Label Hy’s Law quadrants places identifying labels, relating to Hy’s law, in each quadrant of all of the plots of bilirubin versus alanine aminotransferase.
You can choose to normalize the measurements by either the ULN or the baseline measurements for each test. You can select either the last pre-dose values or the means of all pre-dose values as the baseline See Use the Normalize laboratory values by: and Calculate baseline as: for more information.
Use the Set custom reference lines for Hy’s Law plots option to draw reference lines on the Hy’ Law plots. You must then use the Set reference line for bilirubin option to specify the value by which to multiply the ULN for bilirubin and/or alkaline phosphatase. By default, this value is set to 2 or twice the ULN. You must also use the Set reference line for transaminase tests option to specify the value by which to multiply the ULN for alanine and/or aspartate transaminase. By default. this value is set to 3 or 3x the ULN. Set reference line for alkaline phosphatase.
Cumulative Incidence
By default, ALT levels equal to or greater 3*ULN are considered as events for the cummulative incidence screen. ALT levels below this values are not. You can change the value of this cutoff using the ALT Elevation greater than option.
Use the End Date Variable to Use for Censoring option for specifying the end date for censoring. Options include the reference end date (selected by default), date of the last treatment, the date the subject left the study or the date of the last disposition record. You can use the Offset for Censor End Date (in Study Days) option to extend the analysis for an additional specified number of days.
Medical Queries and Adverse Events
You must specify the location of the Medical Query ASCI files. See Location of Medical Query Files for more information.
Additional Filters
Additional filters enable you to further restrict the analysis to a specific subset of subjects and/or findings records, adverse events, and specific visits based on values within variables. The Include the following findings records:and Additional Filter to Include Findings Records enable you to focus your analysis on specific findings data. The Additional Filter to Include Adverse Events and Additional Filter to Include Subjects options enable you to specify additional adverse events and subjects, respectively to be included in the summary.
The Subset of Visits to Analyze option enables you to restrict the analysis to a specific subset of visits.