Digit Preference
This report highlights digit preference bias by reviewing how clinical sites record numerical findings—focusing on whether they disproportionately use certain terminal digits (first or last). Detecting such patterns can surface issues like rounding habits, miscalibration, or inconsistencies in reporting compared to other sites.
Report Results Description
Running Digit Preference for Nicardipine using default settings generates the report shown below.
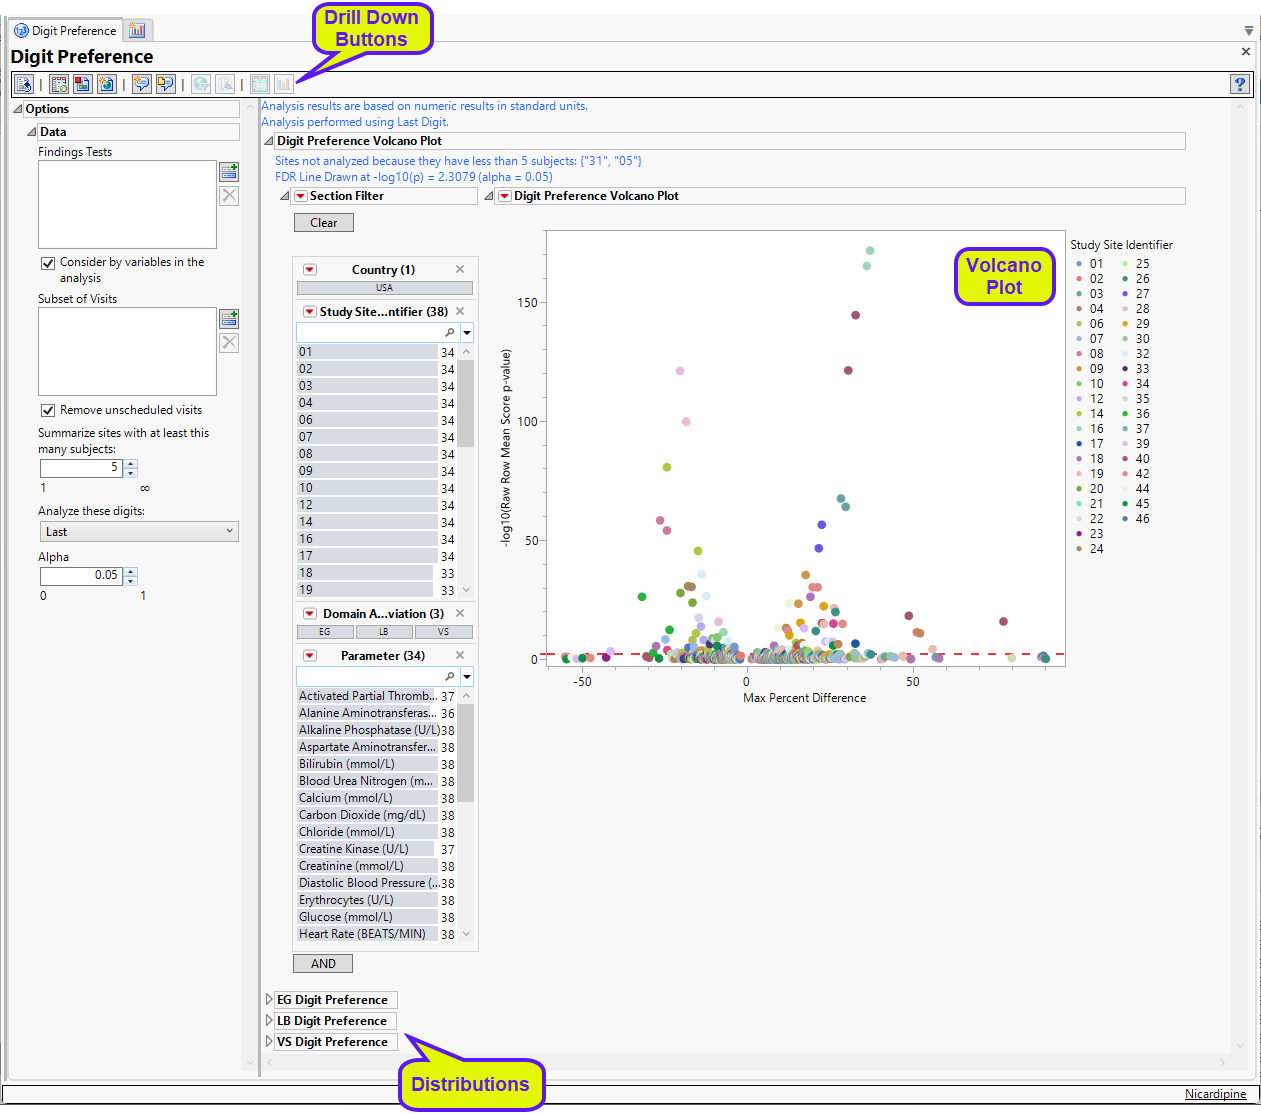
Digit Preference Volcano Plot
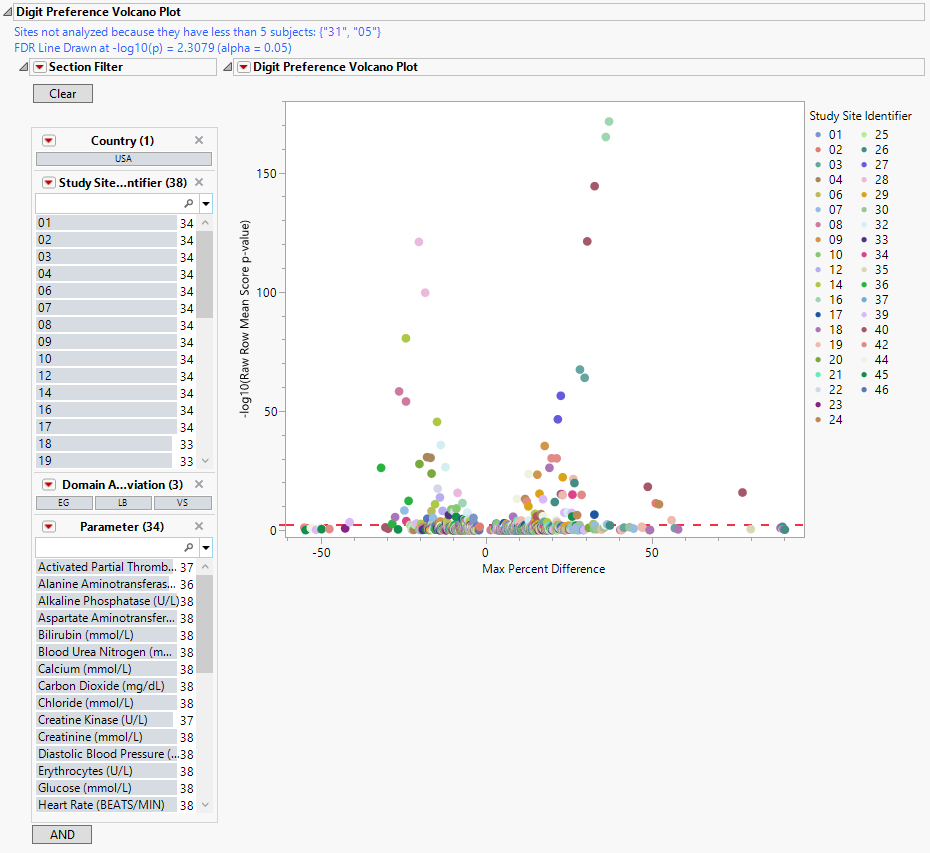
| • | In this volcano plot each point represents the comparison of a site to all other sites. This comparison is used to determine whether there is a difference in distribution for the last digit for a findings test with numeric data available and is done for all sites across all tests in all findings domains. |
The Y axis is the -log10(Raw Row Mean Score p-value), which takes advantage of the ordinality of the final digit value. This test uses standardized midrank scores in case there are gaps due to certain digit values not present. Midranks are a way of scoring the columns when the distance between levels does not necessarily have a practical interpretation. Large numbers on the Y axis indicate statistically significant results.
The X axis is the maximum percent difference across all digits between a site versus all sites. This is the maximum of (p(0 in suspect) - p(0 in reference), p(1 in suspect) - p(1 in reference), … p(9 in suspect) - p(9 in reference)) where p(x) is the percent of records, suspect is the site in question and reference is all other sites that are not the site in question. Values far from 0 indicate important differences between a site and the reference distribution of all other sites. This could identify rounding issues or other problems with how a site reports a particular test compared to other sites.
| • | A section filter enables you to subset and view subjects based on demographic characteristics and other criteria. The default filter enables you to select subjects by study site and lab results. Refer to Data Filter for more information. |
Digit Preference Distributions
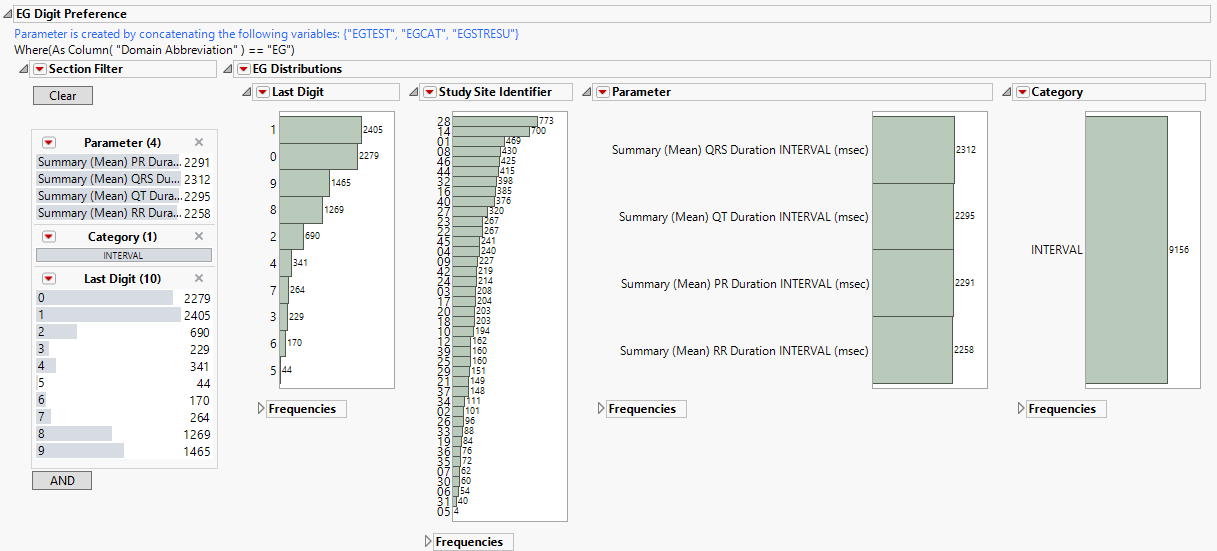
This report generates three sets of distributions, one for each of the LB (top), EG (middle), and VS (bottom) findings domains. Each set shows the number of tests performed at each study site, the numbers of each type of test, and the subjects delineated by the specified digit (first or last) of the subjects’ USUBJID. Selecting any group (for example, all tests for subjects whose USUBJID ends with “1”) as shown above, highlights those tests across all distributions.
Options
Data
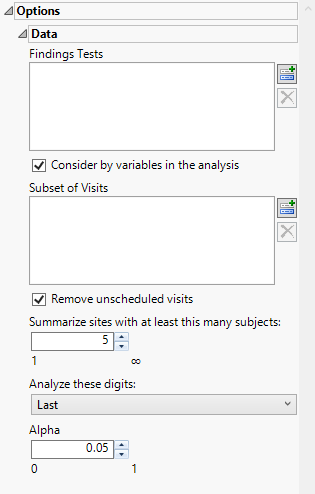
Findings Tests
Use this widget to select Findings Tests for the analysis. The report will autorun and analysis is restricted to the selected tests only.
Consider BY variables in the analysis
You can opt to Consider BY variables in the analysis. This option, which assumes that BY variables (left vs. right arm for collecting blood pressure data, for example) are included in the experimental design, is selected by default. You can uncheck this option to ignore BY variables.
Subset of Visits
Use the Subset of Visits option to select the visits to be included in the analysis. This option allows you to limit the analysis to a selected set of visits when searching for tests with similar or questionable results.
Remove unscheduled visits
You might or might not want to include unscheduled visits when you are analyzing findings by visit. Check the Remove unscheduled visits to exclude unscheduled visits.
Summarize sites with at least this many subjects:
The Summarize sites with at least this many subjects: widget enables you to set a minimal threshold for the sites to be analyzed. Only those sites which exceed the specified number of subjects are included. This feature is useful because it enables you to exclude smaller sites, where small differences due to random events are more likely to appear more significant than they truly are. In larger sites, observed differences from expected attendance due to random events are more likely to be significant because any deviations due to random events are less likely to be observed.
Note: This option applies only to the volcano plot. The distribution plots still include all sites regardless of how this option is specified.
Analyze these digits
Use this widget to specify whether to analyze the first or last digits of any of the numeric findings.
Alpha
The Alpha option is used to specify the significance level by which to judge the validity of the statistics generated by this report. By definition, alpha represents the probability that you will reject the null hypothesis when the null is, in fact, true. Alpha can be set to any number between 0 and 1, but is most typically set at 0.01, 0.05, or 0.10. The higher the alpha, the lower your confidence that the results you observe are correct.
General and Drill Down Buttons
Action buttons provide you with an easy way to drill down into your data. The following action buttons are generated by this report:
| • | Click  to reset all report options to default settings. to reset all report options to default settings. |
| • | Click  to view the associated data tables. Refer to Show Tables for more information. to view the associated data tables. Refer to Show Tables for more information. |
| • | Click  to generate a standardized pdf- or rtf-formatted report containing the plots and charts of selected sections. to generate a standardized pdf- or rtf-formatted report containing the plots and charts of selected sections. |
| • | Click  to generate a JMP Live report. Refer to Create Live Report for more information. to generate a JMP Live report. Refer to Create Live Report for more information. |
| • | Click  to take notes, and store them in a central location. Refer to Add Notes for more information. to take notes, and store them in a central location. Refer to Add Notes for more information. |
| • | Click  to read user-generated notes. Refer to View Notes for more information. to read user-generated notes. Refer to View Notes for more information. |
| • | Select one or more subjects, then click  to apply the Review Subject Filter and filter all reports in the review builder on the selected subjects. to apply the Review Subject Filter and filter all reports in the review builder on the selected subjects. |
| • | Select a group of subjects and click  to specify Derived Population Flags that enable you to distinguish the selected group of subjects from the general population based on their meeting specific criteria. to specify Derived Population Flags that enable you to distinguish the selected group of subjects from the general population based on their meeting specific criteria. |
| • | Select points in the volcano plot and click the Show Sites button ( ) to show the data for the selected sites and tests. ) to show the data for the selected sites and tests. |
| • | Select points in the volcano plot and click the Digit Bar Charts button ( ) to display the last digit distribution between the selected sites versus all others for the points selected. This gives the user the ability to compare just how different each site is for a particular test. ) to display the last digit distribution between the selected sites versus all others for the points selected. This gives the user the ability to compare just how different each site is for a particular test. |
Default Settings
Refer to Set Study Preferences for default Subject Level settings.
Methodology
The report uses the Row Mean Score (RMS) chi-square test (Stokes et al., 2012) to compare each site’s distribution of a chosen terminal digit (first or last) for each numeric finding against a reference pool combining all other sites. The RMS test is a type of Cochran-Mantel-Haenszel (CMH) test used when:
| • | You have categorical data arranged in a 2D contingency table where rows correspond to groups and columns correspond to categories. |
| • | The column categories have a defined, natural order. |
| • | You want to test whether the values in the rows are distributed differently across the columns. |
This test is especially suited for analyzing digit preferences in cases where the digits are ordered (0-9) and you suspect sites of favoring some digits compared to a reference.
Note: When there is only one stratum, the CMH statistic is essentially an analysis of variance (ANOVA) statistic in the sense that it is a function of the variance ratio F statistic that would be obtained from a one-way ANOVA on the dependent variable Y. If nonparametric scores are specified in this case, the ANOVA statistic is a Kruskal-Wallis test.
Row Mean Scores
The RMS for each row is calculated by the following:
where,
nij = count in row i, column j
C = number of categories
ni+ =  = row totals
n+j =  =column totals
n++ =  = grand total
wj = midrank score assigned to column j based on observed counts
 = standardized midrank score
The difference between groups (D*) is calculated as:
Variance of the Difference
The variance of the differences is calculated by the following:
where C = the number of categories. In this case, there are ten categories, one for each digit from 0 - 9.
Test Statistic
p-Values are derived from the chi-square distribution with 1 degree of freedom. The -log10 p-values are plotted on the y axis of the volcano plot above.
References
Stokes ME, Davis CS, Koch GG. (2012). Categorical Data Analysis Using SAS, Third Edition. Cary, NC: SAS Institute, Inc.