Co-occurrence
The Co-occurrence report enables users to explore all pairs of occurrences (adverse events (AE), concomitant medications (CM), deaths) that happen simultaneously within a patient, overlapping in time, and generate an estimate of that overlap in the number of days. Further, users can compare the overlap of occurrences to the marginal frequencies where occurrences happen individually. Further, occurrence pairs will be presented by treatment to assess if certain pairs occur more frequently than others within specific treatments or to compare the amount of time pairs occur together within treatment. This report considers occurrences such as adverse events from the AE domain, concomitant medications from the CM domain, or deaths based on the presence of a death date in either DM or ADSL.
Unlike the Nearby Occurrences report that expects the user to identify reference occurrences of interest to explore other nearby occurrences that appear within a user-defined time window, Co-occurrence looks for the overlap of all possible pairs of occurrences according to the Term of Interest and determines the length of time these occurrence pairs take place within each patient. Nearby Occurrences is more appropriate to examine specific terms of interest, while Co-occurrence examines overlap for all terms to see what relationships might arise.
Report Results Description
Running Co-occurance for Nicardipine using default settings generates the report shown below. Output from the report is organized into sections. Each section contains one or more plots, data panels, data filters, or other elements that facilitate your analysis.
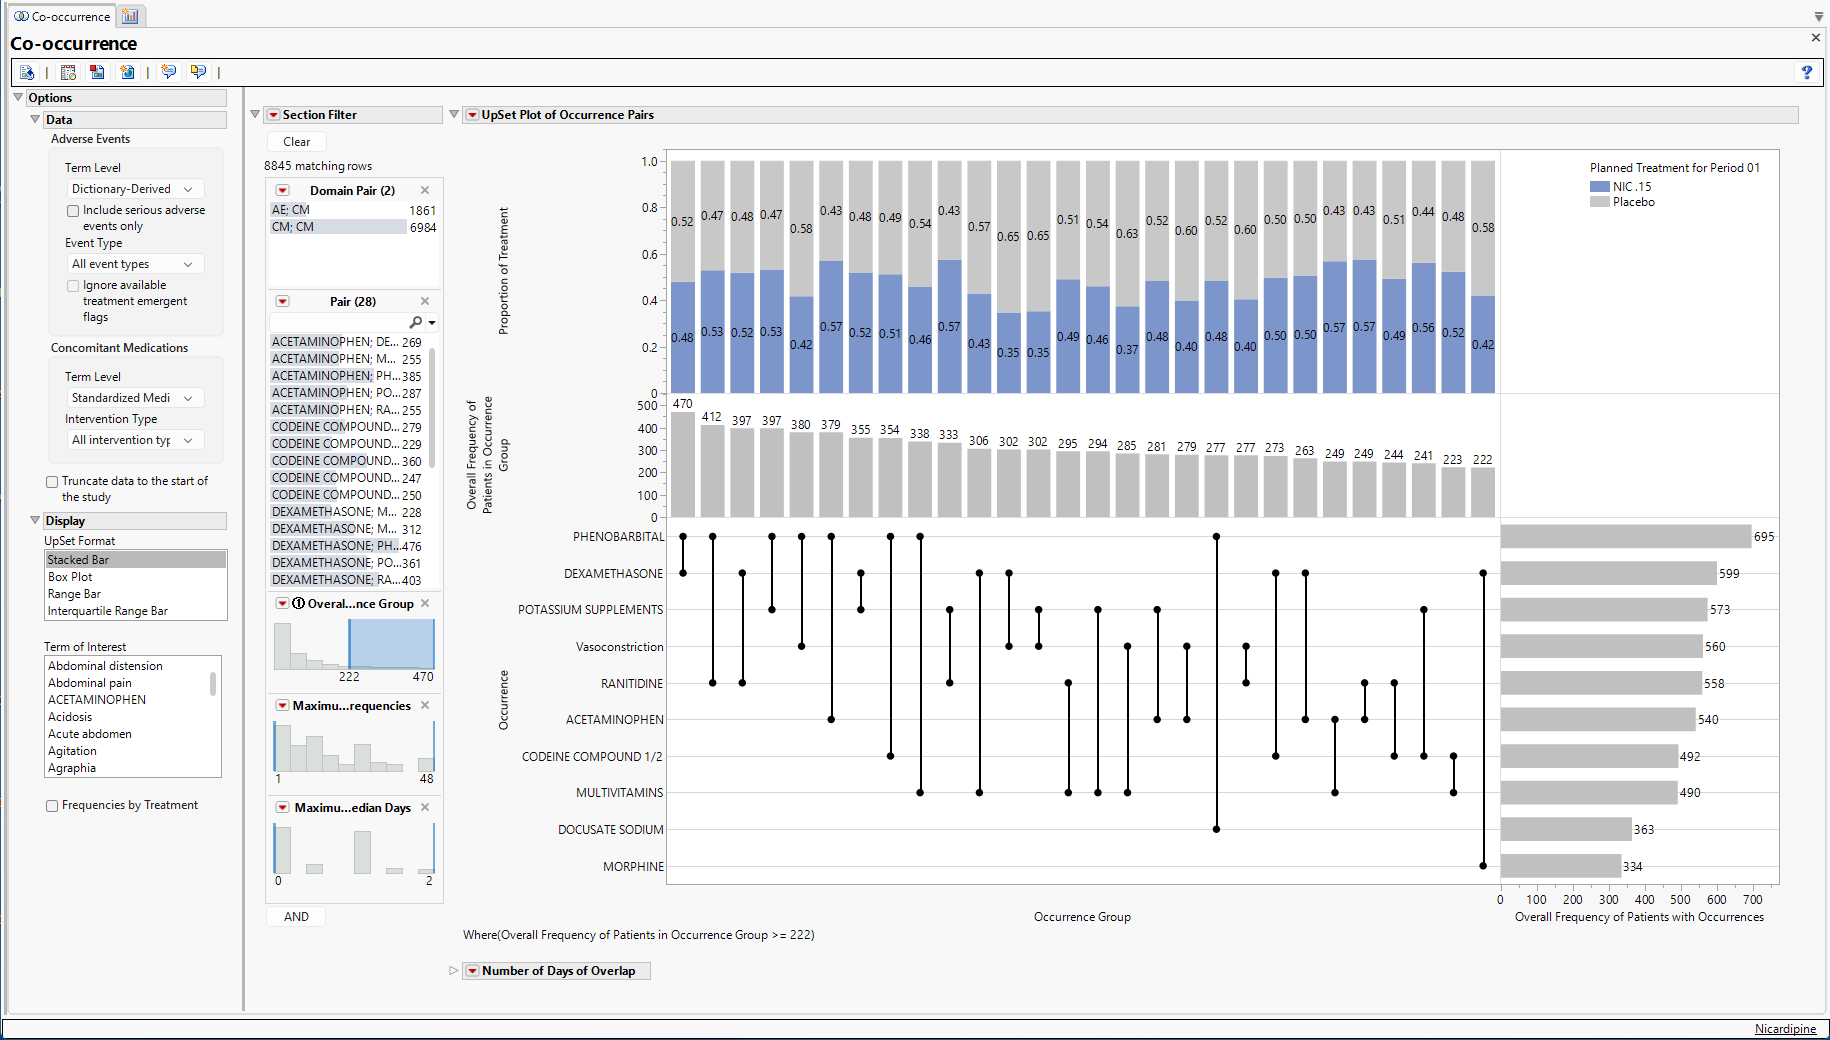
The Report contains the following elements:
Upset Plot
The primary output consists of an UpSet Plot which has several important areas of focus. UpSet plots are used to communicate the frequency of subgroups produced according to one or more factors compared to the marginal frequencies of considering each factor alone.
The Upset plot is shown below:
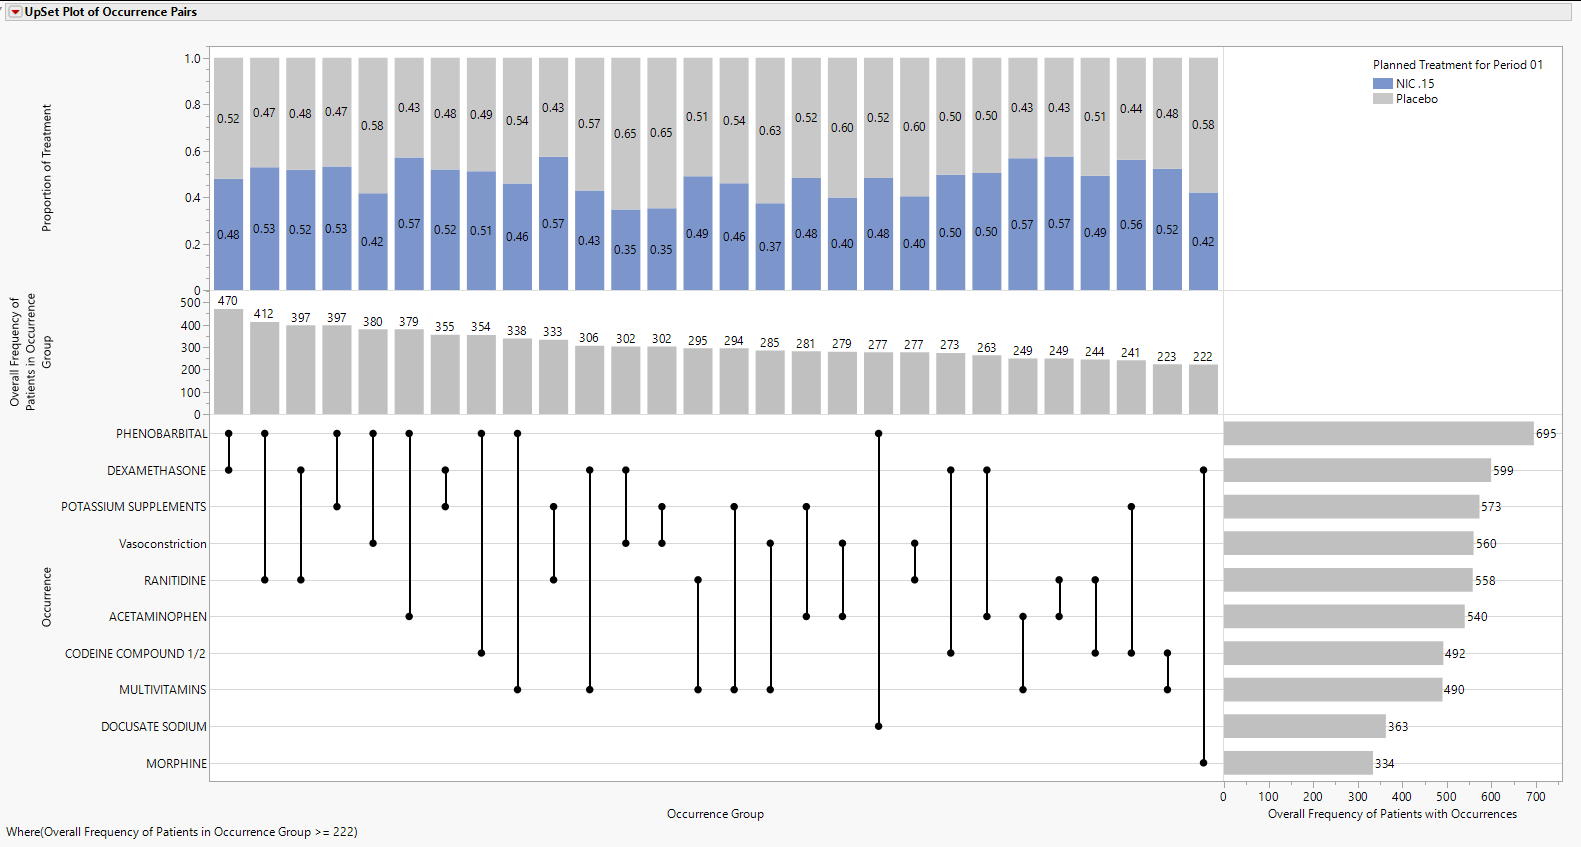
Features of the Upset plot are listed below:
| • | The vertical and horizontal axes are ordered according to these frequencies so that the further right (or down) in the plot, the smaller the frequency. |
| • | The line and dots area of the figure illustrate the connections between Terms of Interest along the Occurrence vertical axis and the Occurrence Group horizontal axis. |
| • | The Bar Chart present in the Overall Frequency of Patients in Occurrence Group vertical axis and Occurrence Group horizontal axis presents the frequency of each Occurrence Group, which for now is limited to pairs of occurrences. This bar chart is presented in decreasing frequency, left to right. |
| • | The bar chart present in the Occurrence vertical axis and the Overall Frequency of Patients with Occurrences horizontal axis presents the frequency of each Occurrence individually. This bar chart is presented in decreasing frequency, top to bottom. |
| • | The top area of the figure, within the Proportion of Treatment vertical axis and the Occurrence horizontal axis is a stacked bar chart which shows the proportion of Occurrence Group pairs that are attributable to a particular treatment. This part of the graph has numerous additional options that are discussed further below. |
For example, phenobarbital and dexamethasone are the left-most pair of terms, indicating that they occur with the greatest frequency (n = 470) among all possible pairs of terms. This overlap in Terms of Interest can be compared to the individual marginal frequencies of phenobarbital (n = 695) and dexamethasone (n = 599). In other words, 695-470=225 patients had phenobarbital with no overlapping dexamethasone, while 599-470=129 patients had dexamethasone with no overlapping phenobarbital. The underlined text highlights a very important distinction about the Co-occurrence report, which specifically looks for pairs of Terms of Interest overlapping in time within patient. A patient could take both phenobarbital and dexamethasone, but if there is no overlap on the same study days, it is not counted towards the 470 patients with phenobarbital and dexamethasone.
So, among the 225 patients with phenobarbital with no overlapping dexamethasone:
| • | A subset will not have dexamethasone at all. |
| • | The remaining patients will have taken some dexamethasone, but not on the same days as phenobarbital. |
Similarly, of the 129 patients that had dexamethasone with no overlapping phenobarbital:
| • | A subset will not have phenobarbital at all. |
| • | The remaining patients will have taken some phenobarbital, but not on the same days as dexamethasone. |
Of these 470 pairs, 0.48 and 0.52 of them occur within patients on Nicardipine or Placebo, respectively. Marginal counts for each treatment are visible in the data table, or the user can click Frequencies by Treatment to change the bar charts to side by side bar charts with sample sizes for each treatment (Figure 3). Although filtering may be needed to view treatment-specific sample sizes, we can observe that 230 and 240 patients on Nicardipine or Placebo, respectively, had the “Dexamethasone, Phenobarbital” pair.
Number of Days of Overlap Table
This table lists summaries by treatment and overall for the Number of Days of Overlap.
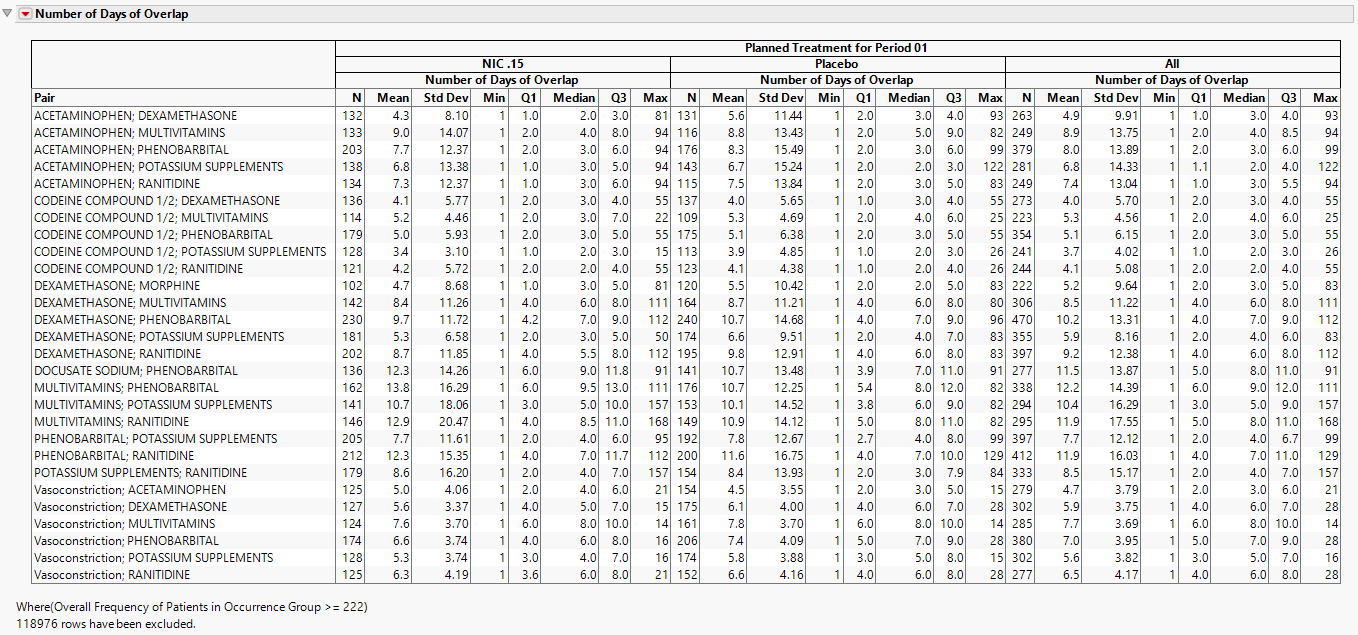
Other summary statistics for the Number of Days of Overlap are available in the data table.
Note: Summary statistics with the word “Overall” contained in column name are across all treatments, while the others are specific to the treatment listed in a particular row.
Details
| 1. | Pairs are built from potentially multiple instances of the individual components present in the data. In other words, when joining individual records to each other, two or more (possibly overlapping) periods of Terms of Interest (say, phenobarbital and dexamethasone) may be identified in the study. However, no attempt to identify and distinguish distinct periods of overlap is currently being made. The Number of Days of Overlap is the frequency of unique study days where both Terms of Interest in an Occurrence Group (currently just pairs) are observed together. |
| 2. | No attempt is being made to assess overlap with respect to the time of day. If the Terms of Interest occur on the same day, they are considered to overlap with each other. |
| 3. | In practice, missing dates for deaths and AEs are likely not to occur. However, medications for chronic disease may have unknown starts dates (indicating the medication was started long in the past) or unknown end dates (implying the drug is still being used to manage disease). While JMP Clinical makes every effort to impute partial dates according to pre-defined rules, in some instances missing dates may still occur. When start or end dates are missing entirely, these will be imputed using the earliest/latest date according to the following rules, assessing the presence of variables in order: |
| • | Start date: Enrollment date (ENRLDT), informed consent date (RFICDT), earliest visit start date (JMPC_ASTDT) |
| • | End date: End of study date (EOSDT), end of participation date (RFPENDT), most recent of visit end date (JMPC_AENDT) or disposition event dates (JMPC_ASTDT). |
| 4. | For instances where the stop dates of medications or AEs were not collected as part of the eCRF design, the stop dates are assumed to be equal to the start dates. In other words, the occurrences start and end on the same day. This assumption is always made for deaths. |
| 5. | For all studies, occurrences are classified according to the treatment arm; this includes the set of treatments for crossover or multi-treatment studies. Further potential enhancements of the Co-occurrence report could assess the overlap of pairs of Terms of Interest in conjunction with the treatment received (even no treatment) on a given study day. |
Section Filter
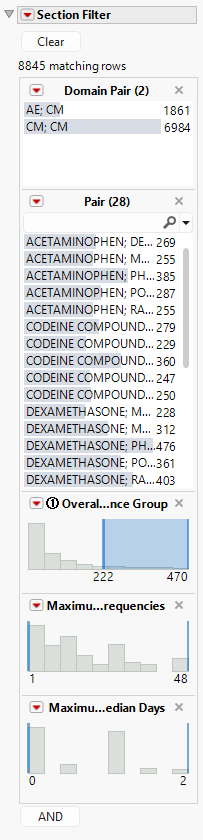
The Section filter includes a number of important columns from the data table by default.
1. Domain Pair lists the domains from where each Term of Interest is derived, and currently includes adverse events (AE), concomitant medications (CM), or deaths (ADSL). This is the most straightforward way to look at overlapping pairs of medications or adverse events, or all medications being taken when death occurred.
2. Pair is the set of Terms of Interest where the first term always comes before the second term alphabetically. This is a useful way to select individual pairs of interest. As described above, all pairs containing a single term can be selected from the Term of Interest list box.
3. Overall Frequency of Patients in Occurrence Group is the total number of patients across all treatments for the Occurrence Group. Essentially, this is the sample size for the bar chart present in the Overall Frequency of Patients in Occurrence Group vertical axis and Occurrence Group horizontal axis.
4. Maximum Difference in Treatment Frequencies is the difference in the maximum and minimum treatment sample size for an Occurrence Group. Essentially, this is the difference derived for the bar chart present in the Overall Frequency of Patients in Occurrence Group vertical axis and Occurrence Group horizontal axis when Frequencies by Treatment is checked.
5. Maximum Difference in Treatment Median Days is the difference in the maximum and minimum treatment median days for the Number of Days of Overlap.
Refer to Data Filter for more information.
Options
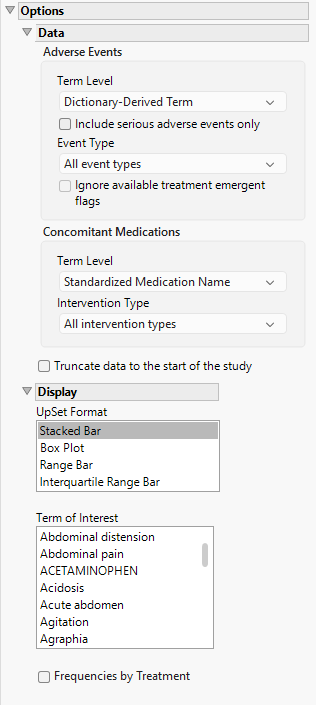
Data - Adverse Events
Term Level
Term Levels are determined by the coding dictionary for the Event domain of interest, typically these levels follow the MedDRA dictionary. Use this widget to specify how each adverse event is named and the level at which the event is considered. For example, selecting Reported Term for the Adverse Event reports the event specified by the actual event term as reported in the AE domain. Refer to Term Level for more information.
Include serious adverse events only
By default, all events are included in the analysis. However, you can opt to include only those considered serious. Checking the Include serious adverse events only widget restricts the analysis to those adverse events defined as Serious under FDA guidelines.
Event Type
Analysis can consider all events or only those that emerge at specific times before, during, or after the trial period. For example, selecting On treatment events as the Event Type includes only those events that occur on or after the first dose of study drug and at or before the last dose of drug (+ the offset for end of dosing).
Ignore available treatment emergent flags
If you choose to ignore available treatment emergent flags, the analysis includes all adverse events that occur on or after day 1 of the study.
Data - Concomitant Medications
Term Level
Term Levels are determined by the coding dictionary for the CM domain, typically these levels follow the MedDRA dictionary. Use this widget to specify how each adverse event is named and the level at which the event is considered. Refer to Term Level for more information.
Intervention Type
Analysis can consider all interventions or only those that occur at specific times before, during, or after the trial period. For example, selecting On treatment events as the Intervention Type includes only those interventions that occur on or after the first dose of study drug and at or before the last dose of drug (+ the offset for end of dosing).
Truncate data to the start of the study
Check this option to truncate start dates to use (in order), enrollment date, informed consent date, or earliest visit date. Note: Checking this option does not delete records (generally medications) if they start prior to the study.
Display
Upset Format
The Upset plot can be displayed in various formats, the default being a stacked Bar Chart (shown above). Other options include a box plot, a range bar or an interquartile range bar. See UpSet Format for more details.
Term of Interest
The Term of Interest list option makes it straightforward to select all pairs in the data filter that contain a particular term. Note: It is important to clear the data filter of current selections since selecting a Term of Interest will respect current filter selections.
Frequencies by Treatment
Check this box to display frequencies by treatment for both the patients in occurrence groups and patients with occurrences.
General and Drill Down Buttons
Action buttons provide you with an easy way to drill down into your data. The following action buttons are generated by this report:
| • | Click  to reset all report options to default settings. to reset all report options to default settings. |
| • | Click  to view the associated data tables. Refer to Show Tables for more information. to view the associated data tables. Refer to Show Tables for more information. |
| • | Click  to generate a standardized pdf- or rtf-formatted report containing the plots and charts of selected sections. to generate a standardized pdf- or rtf-formatted report containing the plots and charts of selected sections. |
| • | Click  to generate a JMP Live report. Refer to Create Live Report for more information. to generate a JMP Live report. Refer to Create Live Report for more information. |
| • | Click  to take notes, and store them in a central location. Refer to Add Notes for more information. to take notes, and store them in a central location. Refer to Add Notes for more information. |
| • | Click  to read user-generated notes. Refer to View Notes for more information. to read user-generated notes. Refer to View Notes for more information. |
Default Settings
Refer to Set Study Preferences for default Subject Level settings.
References
Mallet S. (2023). Interactive Safety Graphics for Regulatory Decision Making: Opportunities and Challenges. PhUSE Webinar.
Ballarini NM, et al. (2020). A critical review of graphics for subgroup analyses in clinical trials. Pharmaceutical Statistics 19: 541–560.