Patient Recruitment
This program is based on a predictive patient enrollment model built on a poisson-gamma distribution, under the assumption that the recruitment has been started, and is currently at an interim time point (Anisimov and Fedorov, 20071). The program first estimates the parameters with maximum likelihood method using enrollment data collected so far. The estimated parameters are then used to predicts future enrollment pattern. If the target time will be missed by a user-defined probability, adaptive adjustment will be launched by predicting the number of new centers necessary for the target enrollment to be reached by the deadline.
Report Results Description
Running Patient Recruitment for the Nicardipine study with a target goal of recruiting 600 additional subjects within 9 months generates the report shown below:
Note: The recruitment target number and date in the example shown here were chosen to ensure that the Adaptive Adjustment algorithm was invoked.
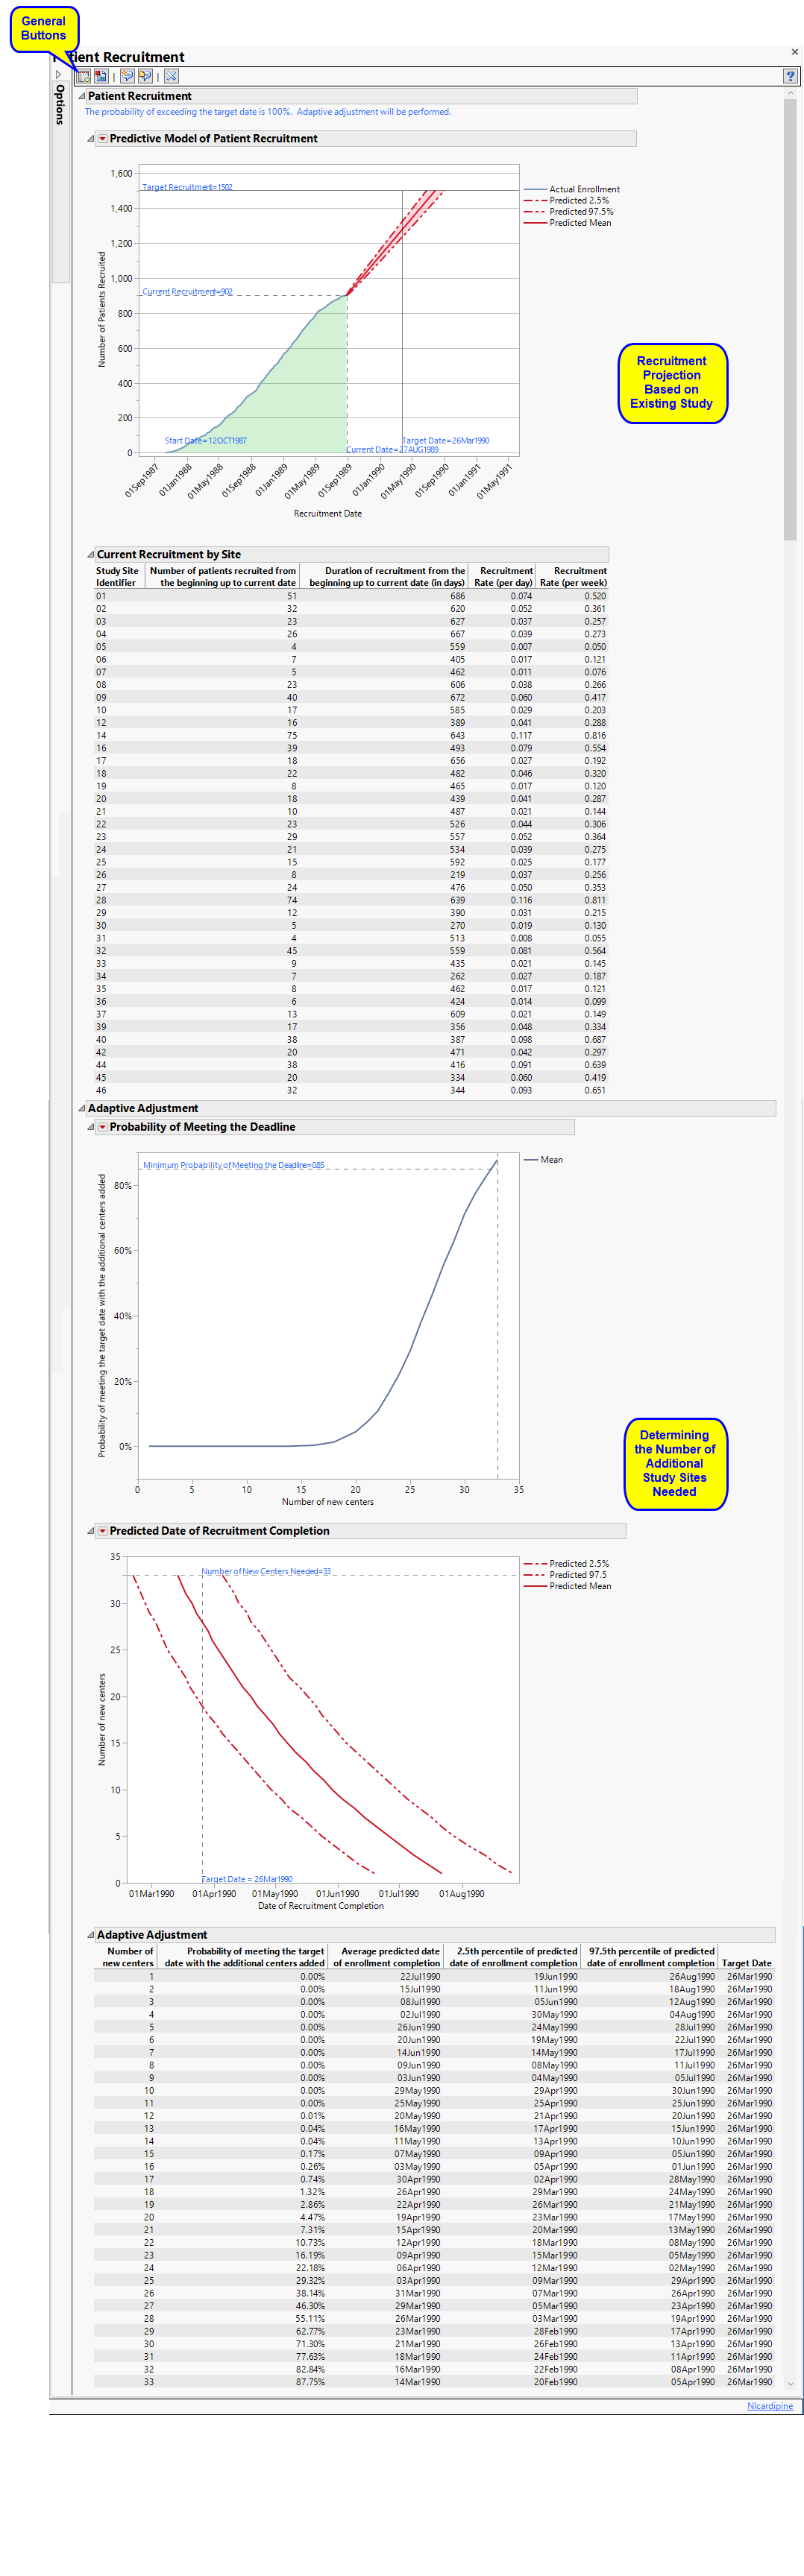
The report consists of the following elements:
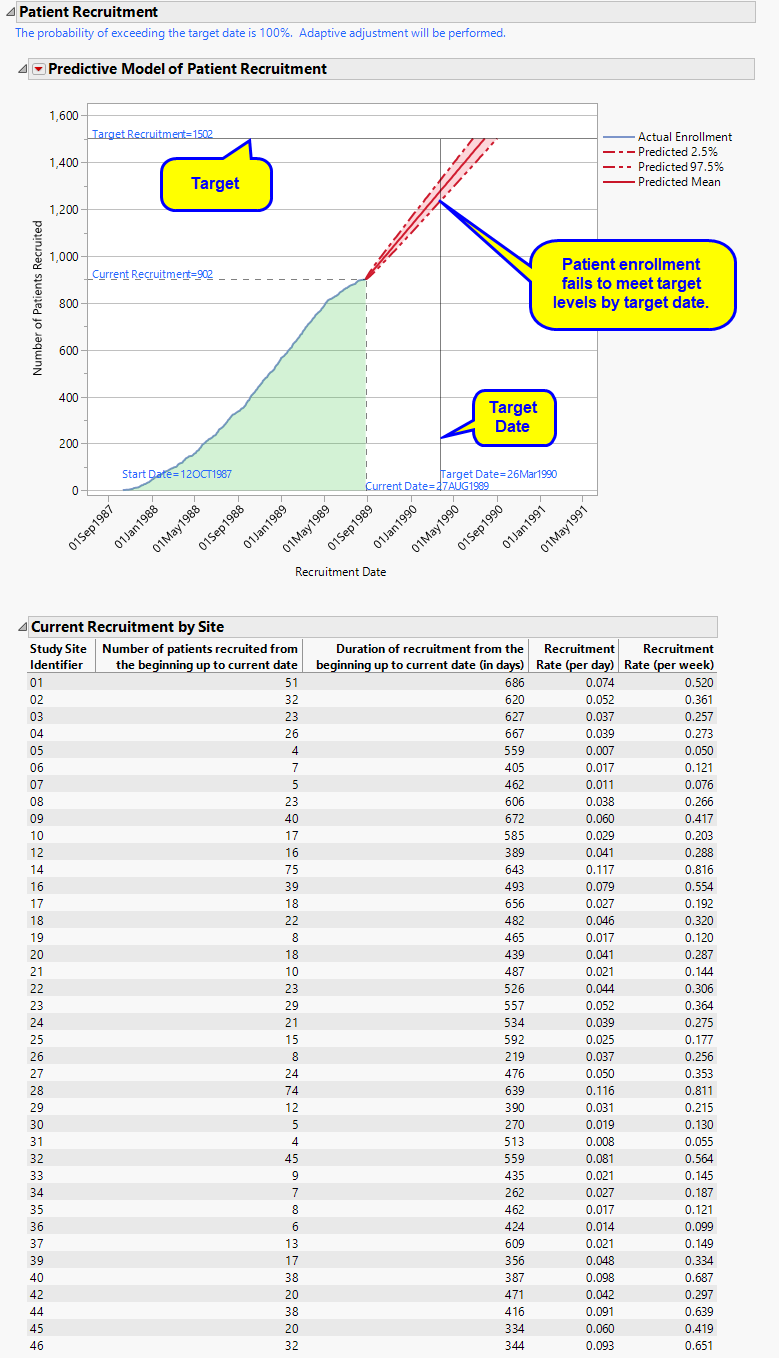
Patient Recruitment
Displays recruitment history and predictions.
This section contains the following
| • | One plot showing patient recruitment over time along with the projected recruitment, based on recruitment history and assuming the number of study remains the same. Target recruitment numbers and deadline are indicated. To meet study requirements, projected enrollments must reach target levels before the deadline. |
In this example, projections suggest that, given the established number of study sites and rate of recruitment, the study will fail to recruit the desired number of subjects by the target date.
| • | One table summarizing recruitment statistics. |
Note: When predicted subject enrollment is insufficient, as shown in this example, the Adaptive Adjustment protocol is invoked.
Adaptive Adjustment
Displays number of additional study centers needed to meet the recruitment deadline and the predicted date of completion.
Note: This section is displayed only when recruitment is predicted to be insufficient.
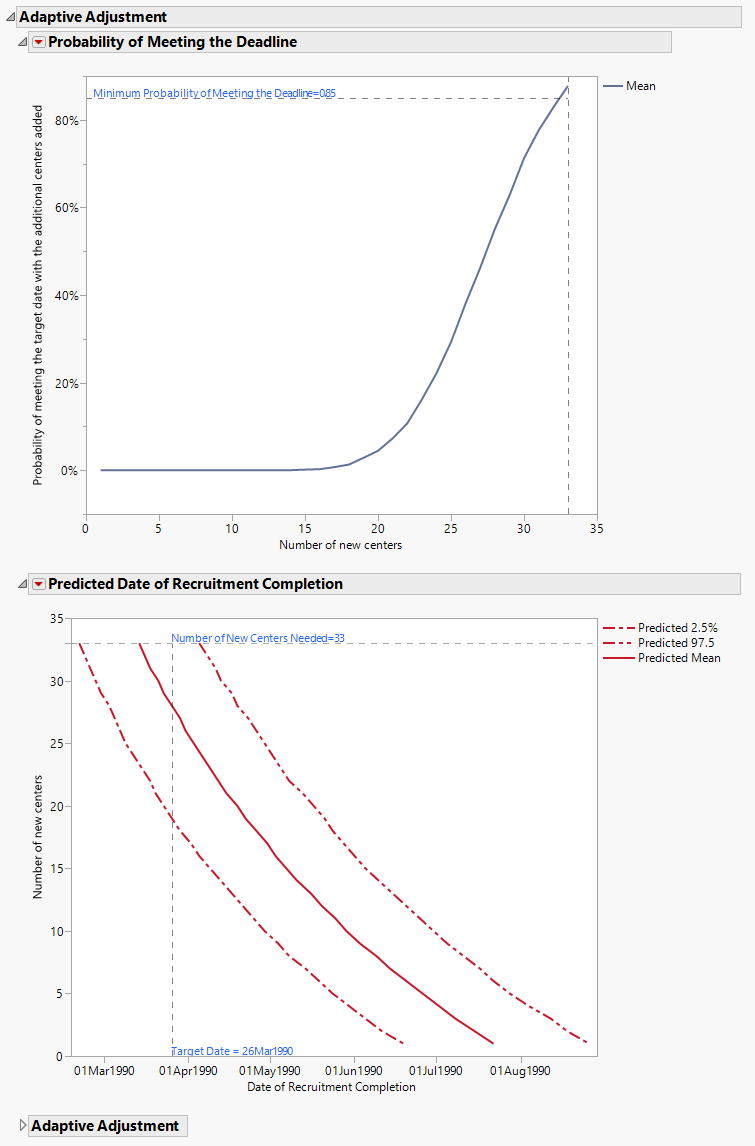
The Adaptive Adjustment section contains the following elements:
| • | One plot showing the number of additional study centers needed to achieve the minimum acceptable probability of meeting recruitment goal by the target deadline. |
In this example, a minimum of 14-15 additional centers are needed.
| • | One plot showing the expected date of completion, given different numbers of additional centers. |
In this example, the predicted date of completion is met only by the addition of 14-15 new centers.
| • | One table summarizing the adjustment statistics. |
General
| • | Click  to view the associated data tables. Refer to View Data for more information. to view the associated data tables. Refer to View Data for more information. |
| • | Click  to generate a standardized pdf- or rtf-formatted report containing the plots and charts of selected sections. to generate a standardized pdf- or rtf-formatted report containing the plots and charts of selected sections. |
| • | Click  to generate a JMP Live report. Refer to Create Live Report for more information. to generate a JMP Live report. Refer to Create Live Report for more information. |
| • | Click  to take notes, and store them in a central location. Refer to Add Notes for more information. to take notes, and store them in a central location. Refer to Add Notes for more information. |
| • | Click  to read user-generated notes. Refer to View Notes for more information. to read user-generated notes. Refer to View Notes for more information. |
| • | Click the arrow to reopen the completed report dialog used to generate this output. |
| • | Click the gray border to the left of the Options tab to open a dynamic report navigator that lists all of the reports in the review. Refer to Report Navigator for more information. |
Report Options
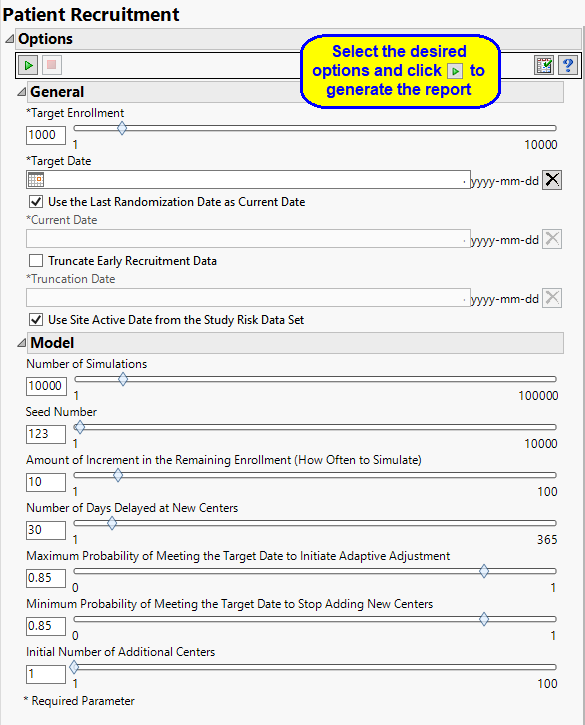
Establishing Model Parameters
The first step in setting up the predictive model is to specify the how many patients are needed and the time needed to recruit them.
Use the Target Enrollment and Target Date options, respectively, to specify the total number of subjects needed across all study sites and the desired start date for the study.
This report uses current patient recruitment as the basis for predicting how successful you will be at recruiting
Use the Last Randomization Date as Current Date, Current Date, Truncate Early Recruitment Data, Truncation Date, Use Site Active Date from the Study Risk Data Set
Options
Number of Simulations, Seed Number, Amount of Increment in the Remaining Enrollment (How Often to Simulate), Number of Days Delayed at New Centers, Maximum Probability of Meeting the Target Date to Initiate Adaptive Adjustment, Minimum Probability of Meeting the Target Date to Stop Adding New Centers, Initial Number of Additional Centers