Create the design following the steps in the design workflow process outlined in The DOE Workflow: Describe, Specify, Design:
|
1.
|
Select DOE > Custom Design.
|
|
2.
|
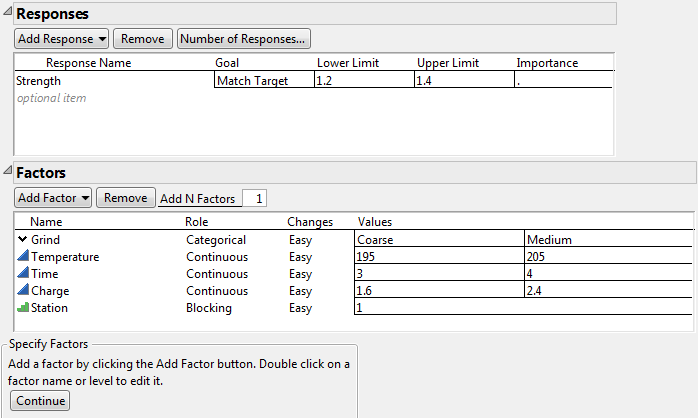
Note that the default Goal is Maximize. Your goal is to find factor settings that enable you to brew coffee with a target strength of 1.3, within limits of 1.2 and 1.4.
|
3.
|
Figure 2.4 Selection of Match Target as the Goal
|
4.
|
Click under Lower Limit and type 1.2.
|
|
5.
|
Click under Upper Limit and type 1.4.
|
|
6.
|
Leave the area under Importance blank.
|
For this example, you can choose either option. See Entering Factors Manually or see Entering Factors Using Load Factors.
|
1.
|
Click Add Factor > Categorical > 2 Level.
|
|
2.
|
Note that Role is set to Categorical, as requested. The Changes attribute is set to Easy by default, indicating that Grind settings can be reset for every run.
|
4.
|
|
–
|
Temperature (195 and 205)
|
|
–
|
Time (3 and 4)
|
|
–
|
Charge (1.6 and 2.4)
|
|
6.
|
Click Add Factor > Blocking > 4 runs per block.
|
|
7.
|
Figure 2.5 Completed Responses and Factors Outlines
|
8.
|
Click Continue.
|
|
–
|
|
1.
|
From the Custom Design red triangle menu, select Load Factors.
|
|
2.
|
|
–
|
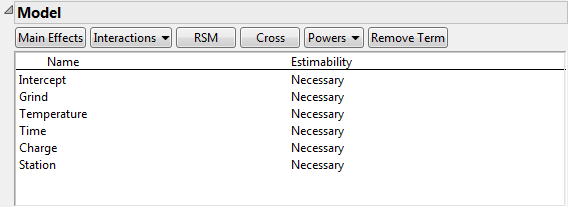
Figure 2.7 shows the Model outline. The Model outline is where you specify your assumed model, which contains the effects that you want to estimate. See Specify. The list that appears by default shows all main effects as Necessary, indicating that the design is capable of estimating all main effects. Because your main interest at this point is in the main effects of the factors, you do not add any effects to the Model outline.
Figure 2.6 Model Outline with Main Effects Only
Because the Custom Design algorithm begins with a random starting design, your design might differ from the one shown in Figure 2.8. To obtain a design with exactly the same runs, perform the following steps before generating your design:
|
1.
|
From the Custom Design red triangle menu, select Set Random Seed.
|
|
3.
|
Click OK.
|
|
4.
|
From the Custom Design red triangle menu, select Number of Starts.
|
|
5.
|
|
6.
|
Click OK.
|
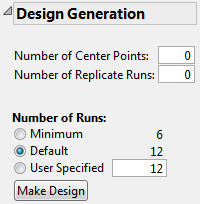
In the Design Generation outline, you can enter additional details about the structure and size of your design. The Default design is shown as having 12 runs. Recall that your design budget allows for 12 runs (Number of Runs).
Figure 2.7 Design Generation Outline
|
1.
|
Click Make Design.
|
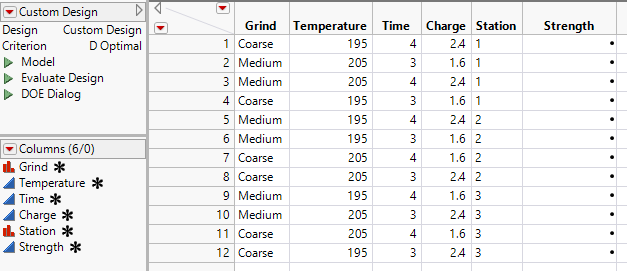
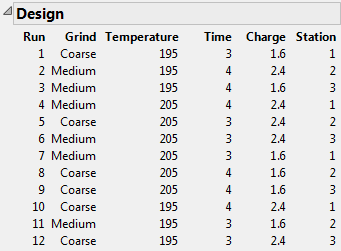
The Design outline shows the design (Figure 2.8). If you did not follow the steps in Steps to Duplicate Results (Optional), your design might be different from the one in Figure 2.8. This is because the algorithm begins with a random starting design.
Figure 2.8 Design for Coffee Experiment
The Design Evaluation outline provides various ways to evaluate your design. This is an important topic, but for simplicity, it is not covered in the context of this example. See the Evaluate Designs topic.
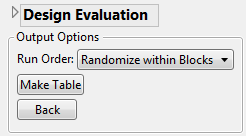
Specify the order of runs in your data table using the Output Options panel. The default selection, Randomize within Blocks, is appropriate. This selection arranges the runs in a random order for each Station.
Figure 2.9 Output Options
|
1.
|
Click Make Table.
|
The data table shown in Figure 2.10 opens. Keep in mind that, if you did not follow the steps in Steps to Duplicate Results (Optional), your design table might be different. Your design table represents another optimal design.
Figure 2.10 Custom Design Table