JMP 14.1 Online Documentation (English)
Discovering JMP
Using JMP
Basic Analysis
Essential Graphing
Profilers
Design of Experiments Guide
Fitting Linear Models
Predictive and Specialized Modeling
Multivariate Methods
Quality and Process Methods
Reliability and Survival Methods
Consumer Research
Scripting Guide
JSL Syntax Reference
JMP iPad Help
JMP Interactive HTML
Capabilities Index
JMP 13 Online Documentation
JMP 12 Online Documentation
Design of Experiments Guide • Starting Out with DOE
Previous
•
Next
Starting Out with DOE
Example and Key Concepts
A designed experiment is a controlled set of tests designed to model and explore the relationship between factors and one or more responses. JMP includes a variety of tools that enable you to create efficient experimental designs that work for your situation. In particular, these classes of designs are available:
•
The Custom Design platform customizes a design for your unique situation. It constructs designs that accommodate any number of factors of any type and factors that are difficult to change (split plot situations). You control the number of runs.
•
The Definitive Screening Design platform constructs an innovative class of screening designs where main effects are not aliased with each other or with two-way interactions. These designs also allow estimation of quadratic terms.
•
The Screening Design, Response Surface Design, Full Factorial Design, Mixture Design, and Taguchi Arrays platforms construct traditional experimental designs.
•
The Covering Array, Choice Design, Space Filling Design, Accelerated Life Test Design, and Nonlinear Design platforms construct specialized design types.
The Evaluate Design and Augment Design platforms provide tools for evaluating and augmenting existing design. The Sample Size and Power platform addresses sample size and power calculations for specialized situations.
This chapter presents an example that illustrates the JMP approach to DOE. This chapter also discusses the framework for DOE, the workflow that supports design creation, and principles that are fundamental to DOE.
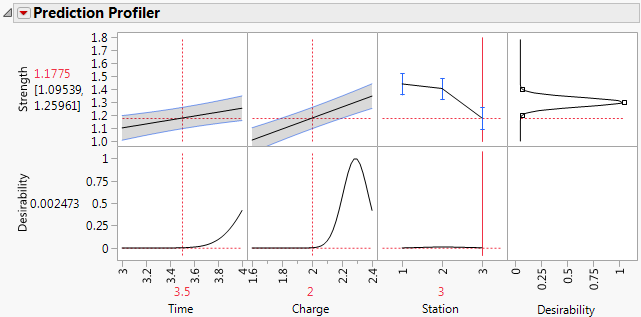
Figure 2.1
Example of a Profiler Plot
Contents
Overview of Experimental Design and the DOE Workflow
The Coffee Strength Experiment
Define the Study and Goals
Create the Design
Run the Experiment
Analyze the Data
The DOE Workflow: Describe, Specify, Design
Define Responses and Factors
Specify the Model
Generate the Design
Evaluate the Design
Make the Table
Principles and Guidelines for Experimental Design
Effect Hierarchy
Effect Heredity
Effect Sparsity
Center Points, Replicate Runs, and Testing
Previous
•
Next
Help created on 10/11/2018