 Show MLE Parameter Estimates
(Not available if Hierarchical Bayes is selected on the launch window.) Tests each factor in the model by constructing a likelihood ratio test for all the effects involving that factor. For more information about Joint Factor Tests, see Joint Factor Tests in the Fitting Linear Models book.
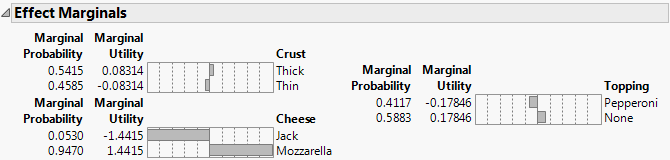
In Figure 5.18, the marginal probability of any subject choosing a pizza with mozzarella cheese, thick crust and pepperoni, over that same pizza with Monterey Jack cheese instead of mozzarella, is 0.9470.
Figure 5.18 Example of Marginal Effects
Shows the predicted utility for different factor settings. The utility is the value predicted by the linear model. See Find Optimal Profiles for an example of the Utility Profiler. For details about utility, see Utility and Probabilities. For details about the Utility Profiler options, see Prediction Profiler Options in the Profilers book.
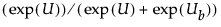
where U is the utility for the current settings and Ub is the utility for the baseline settings. This implies that the probability for the baseline settings is 0.5. For details, see Utility and Probabilities.
See Comparisons to Baseline for an example of using the Probability Profiler. For details about the Probability Profiler options, see Prediction Profiler Options in the Profilers book.
Provides the number of probability profilers that you specify. This enables you to set each profiler to the settings of a given profile so that you can compare the probabilities of choosing each profile relative to the others. See Multiple Choice Comparisons for an example of using the Multiple Choice Profiler. For details about the Multiple Choice Profiler options, see Prediction Profiler Options in the Profilers book.
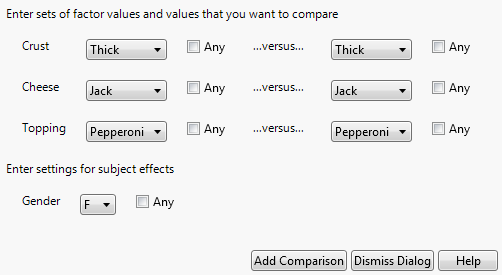
Performs comparisons between specific alternative choice profiles. Enables you to select the factors and the values that you want to compare. You can compare specific configurations, including comparing all settings on the left or right by selecting the Any check boxes. If you have subject effects, you can select the levels of the subject effects to compare. Using Any does not compare all combinations across features, but rather all combinations of comparisons, one feature at a time, using the left settings as the settings for the other factors.
Figure 5.19 Utility Comparisons Window
Constructs a new table that has a row for each subject containing the average (Hessian-scaled-gradient) steps for the likelihood function on each parameter. This corresponds to using a Lagrangian multiplier test for separating that subject from the remaining subjects. These values can later be clustered, using the built-in-script, to indicate unique market segments represented in the data. For more details, see Gradients. For an example, see Example of Segmentation.
 Save Subject Estimates
(Available only if Hierarchical Bayes is selected.) Creates a table where each row contains the subject-specific parameter estimates for each effect. The distribution of subject-specific parameter effects for each effect is centered at the estimate for the term given in the Bayesian Parameter Estimates report. The Subject Acceptance Rate gives the rate of acceptance for draws of new parameter estimates during the Metropolis-Hastings step. Generally, an acceptance rate of 0.20 is considered to be good. See Bayesian Parameter Estimates.
 Save Bayes Chain
(Available only if Hierarchical Bayes is selected.) Creates a table that gives information about the chain of iterations used in computing subject-specific Bayesian estimates. See Save Bayes Chain.
Shows the Choice launch window, which can be used to modify and re-fit the model. You can specify new data sets, new IDs, and new model effects.
See Redo Menus and Save Script Menus in the Using JMP book for more information about the following options: