|
1.
|
|
2.
|
Select Graph > Scatterplot 3D.
|
|
3.
|
|
4.
|
Click OK.
|
|
5.
|
From the red triangle menu, select Nonpar Density Contour.
|
|
6.
|
Select Grouped by Column.
|
|
7.
|
Select Species and click OK. A different colored contour is displayed for each of the three species.
|
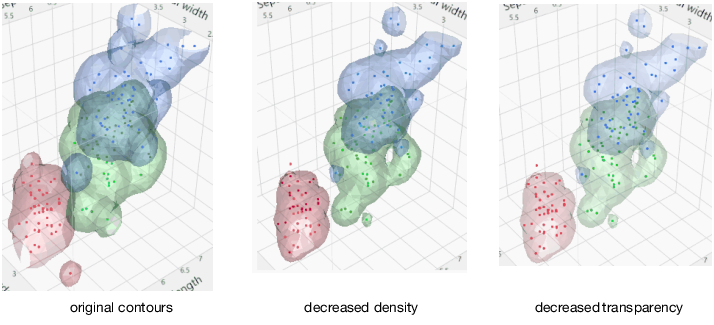
Figure 5.11 Adding a Second Nonparametric Density Contour
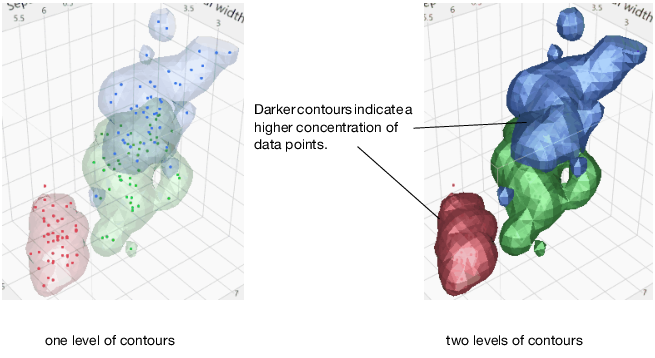
The options for formatting the grouped and ungrouped nonparametric density contours are similar. The only difference is that you cannot change the color of each grouped nonparametric density contour. See Scatterplot 3D Platform Options for options.