For static bubble plots, you might specify one or two ID variables and no Time variable. The resulting bubble plot contains a bubble at each ID value. Note that although this bubble plot is static, you can perform splitting on bubbles.
|
1.
|
|
2.
|
Select Graph > Bubble Plot.
|
|
3.
|
|
4.
|
|
5.
|
|
6.
|
|
7.
|
Click OK.
|
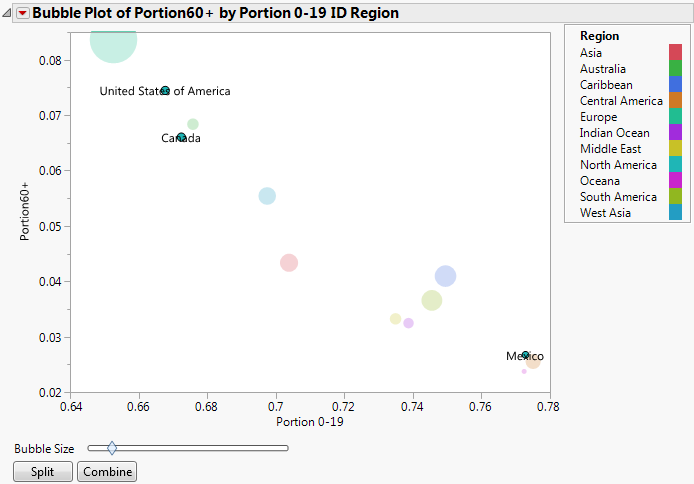
The initial report window appears. (Figure 7.9 uses the default JMP colors.)
Figure 7.9 Initial Report Window with ID Variables
|
9.
|
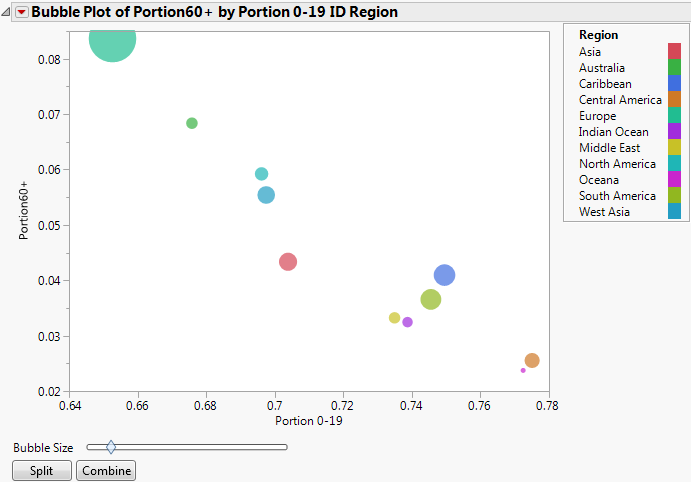
Click Split.
|
Figure 7.10 Splitting the North America Bubble