Launch the Control Chart Builder by selecting Analyze > Quality and Process > Control Chart Builder.
Figure 2.4 Initial Control Chart Builder Window
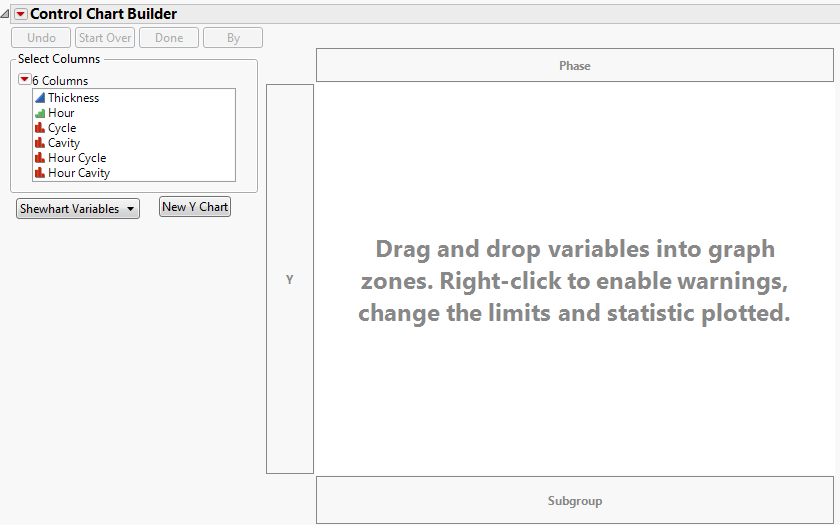
To begin creating a control chart, drag variables from the Select Columns box into the zones. If you drop variables in the center, JMP guesses where to put them based on whether the variables are continuous or categorical. The Control Chart Builder contains the following zones:
Assigns subgroup variables. To define subgroup levels as a combination of multiple columns, add multiple variables to the Subgroup zone. When a subgroup variable is assigned, each point on the control chart corresponds to a summary statistic for all of the points in the subgroup.
Assigns phase variables. When a Phase variable is assigned, separate control limits are computed for each phase. See also Add Color to Delineate Phases
Hides the buttons and the Select Columns box and removes all drop zone outlines. In this presentation-friendly format, you can copy the graph to other programs. To restore the window to the interactive mode, click Show Control Panel on the Control Chart Builder red triangle menu.
Allows you to select Shewhart Variables, Shewhart Attribute, or Rare Event control chart types. If you select an Attribute chart type, an n Trials box and zone appear on the chart.
Produces a copy of the current chart for every column selected in the Select Columns box. The new charts use the selected columns in the Y role.
Once you drag variables to the chart, other buttons and options appear at left that enable you to show, hide or switch items on the chart (See Figure 2.5). Many of these functions (Points, Limits, Warnings, etc.) are the same as the functions available when you right-click the chart. For more information, refer to Options Panel and Right-Click Chart Options. For information about warnings and rules, see Tests and Westgard Rules.
The Event Chooser is available for attribute charts with response columns that have a modeling type of nominal or ordinal. If you want the Event Chooser to work on a numeric integer-valued nominal or ordinal response column, you must select the Use Event Chooser option from the red triangle menu. The Event Chooser does not appear for response columns with a modeling type of continuous.