Power depends on the number of runs, the significance level, and the estimated error variation. For details about how power is calculated, see Power Calculations in Technical Details.
Figure 15.20 Power Analysis Outline for Three Designs
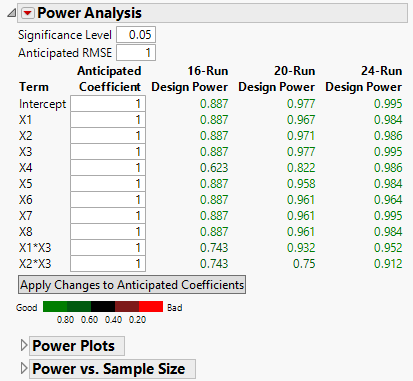
Figure 15.20 shows the Power Analysis outline for the three designs constructed in Designs of Different Run Sizes. Two two-way interactions have been added to the Model outline.
The power values are colored according to a color gradient that appears under the Apply Changes to Anticipated Coefficients button. You can control the color legend using the options in the Power Analysis red triangle menu. See Color Dashboard.
A value for the coefficient associated with the model term. This value is used in the calculations for Power. When you set a new value in the Anticipated Coefficient column, click Apply Changes to Anticipated Coefficients to update the Power calculations.
Calculations use the specified Significance Level and Anticipated RMSE. For details about the power calculation, see Power for a Single Parameter in Technical Details.
When you set a new value in the Anticipated Coefficient column, click Apply Changes to Anticipated Coefficients to update the Power values.
Calculations use the specified Significance Level and Anticipated RMSE. For details about the power calculation, see Power for a Categorical Effect in Technical Details.
Figure 15.21 Power Plot for Three Designs
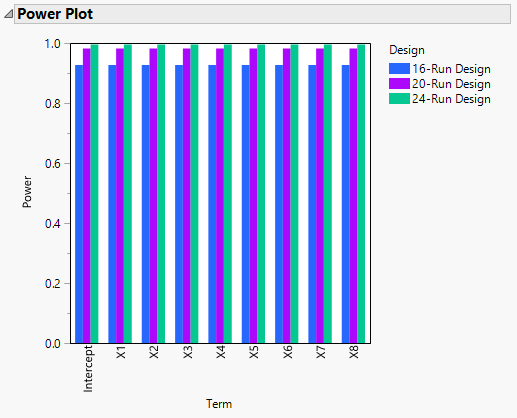
The Power Plot in Figure 15.21 is for the three designs constructed in Designs of Different Run Sizes. Two two-way interactions have been added to the Model outline.
Figure 15.22 Power versus Sample Size Profiler for Three Designs
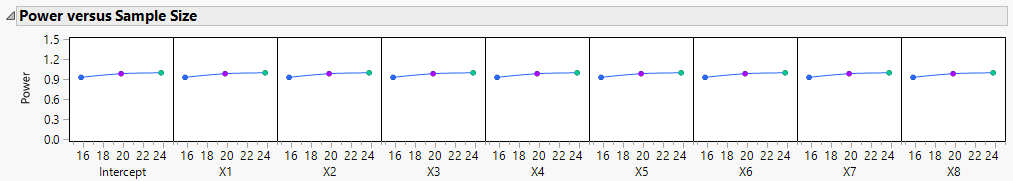
The Power versus Sample Size profiler in Figure 15.22 is for the three designs constructed in Designs of Different Run Sizes. Two two-way interactions have been added to the Model outline. Notice that the power for X4 increases more dramatically with sample size than does the power for other factors.