dt = Open( "$SAMPLE_DATA/Big Class.jmp" );
biv = dt << Bivariate(
Y( :weight ),
X( :height ),
Fit Mean( {Line Color( {57, 177, 67} )} )
);
|
2.
|
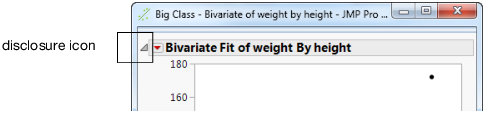
Right-click the top disclosure icon and select Edit > Show Tree Structure.
|
Figure 10.2 Top Disclosure Icon
|
3.
|
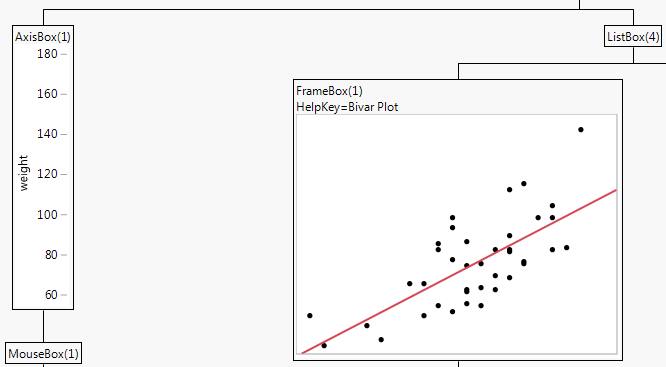
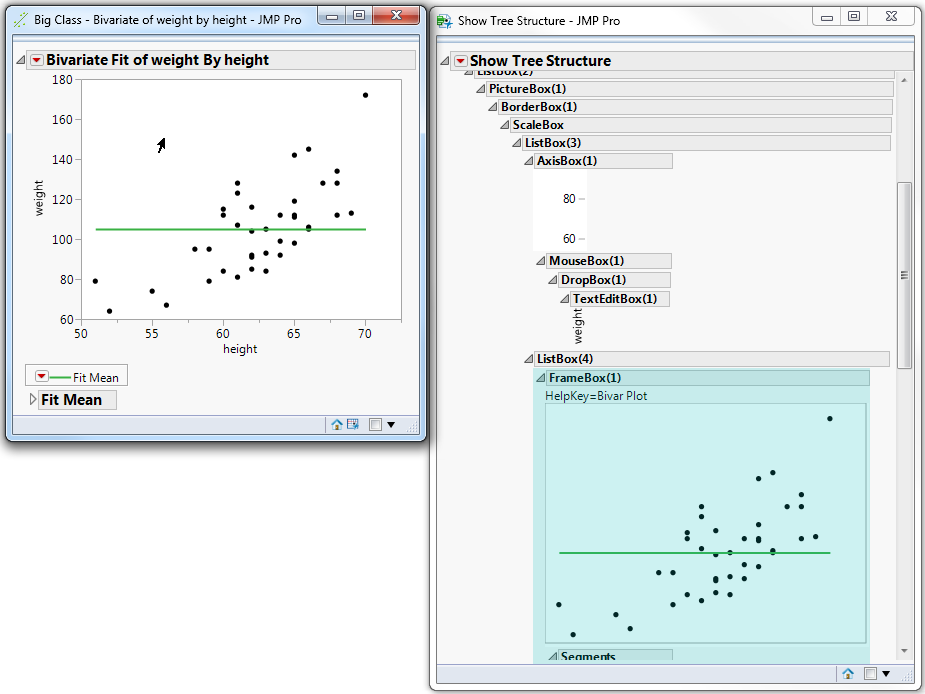
Click the Bivariate graph. In Figure 10.3, the frame box that contains the graph is highlighted.
|
Figure 10.3 Show Tree Structure
You can also obtain the tree structure through a script. Send the Show Tree Structure() message to any report. Or, send the message to a piece of the report (any display box object) to see the tree structure for just that part of the report.
The newer JMP tree structure provides a flat view of the display box tree rather than an outline view. To view the classic structure, hold down the Shift key before you right-click the disclosure icon and then select Edit > Show Tree Structure. Note the following differences between the newer and classic tree structure views:
Figure 10.4 Partial View of the Classic Tree Structure