There is an easy way to format reports before you save them to a script. You can edit the display box properties such as color and position in the Show Tree Structure window. In the Show Tree Structure window, select Show Properties from the red triangle menu and click the node that you want to edit.
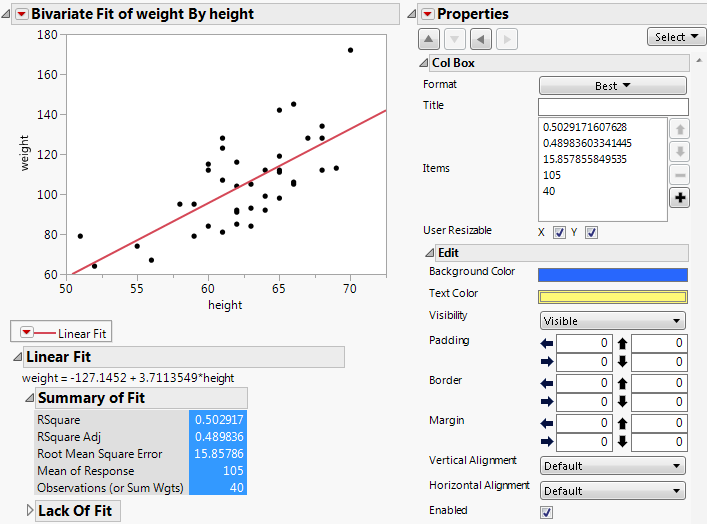
In Figure 10.5, the Summary of Fit statistics were selected below the graph. The Background Color and Text Color were then changed in the Properties. These changes are preserved when you save the report as a script or journal the report.
Figure 10.5 Example of Show Properties for Plot