One of the messages that you can send a platform is the Report message. The Report message retrieves the display box that holds the report.
dt = Open( "$SAMPLE_DATA/Big Class.jmp" );
biv = dt << Bivariate( // biv references the analysis layer
X( height ),
Y( weight ),
Fit Mean,
Fit Polynomial( 4 )
);
To get a reference to the display box that represents the view of the platform, use the Report message. For example, add this expression to the preceding script:
rbiv = biv << Report; // rbiv references the report layer
Now you can manipulate the display boxes in the report layer as described in the following sections.
The following example creates a Bivariate report and stores its reference in the rbiv report object. It then puts the rbiv report object in a frame box and assigns the fbx variable.
dt = Open( "$SAMPLE_DATA/Big Class.jmp" );
biv = dt << Bivariate( // biv references the analysis layer
Y( :weight ),
X( :height ),
Fit Mean( {Line Color( {57, 177, 67} )} )
);
rbiv = biv << Report; // assign rbiv to the report layer
fbx = rbiv[Frame Box( 1 )];
fbx << Set Background Color( blue ); // colors the frame box in blue
The Set Background Color message works the same as right-clicking in the graph and selecting Background Color > Blue.
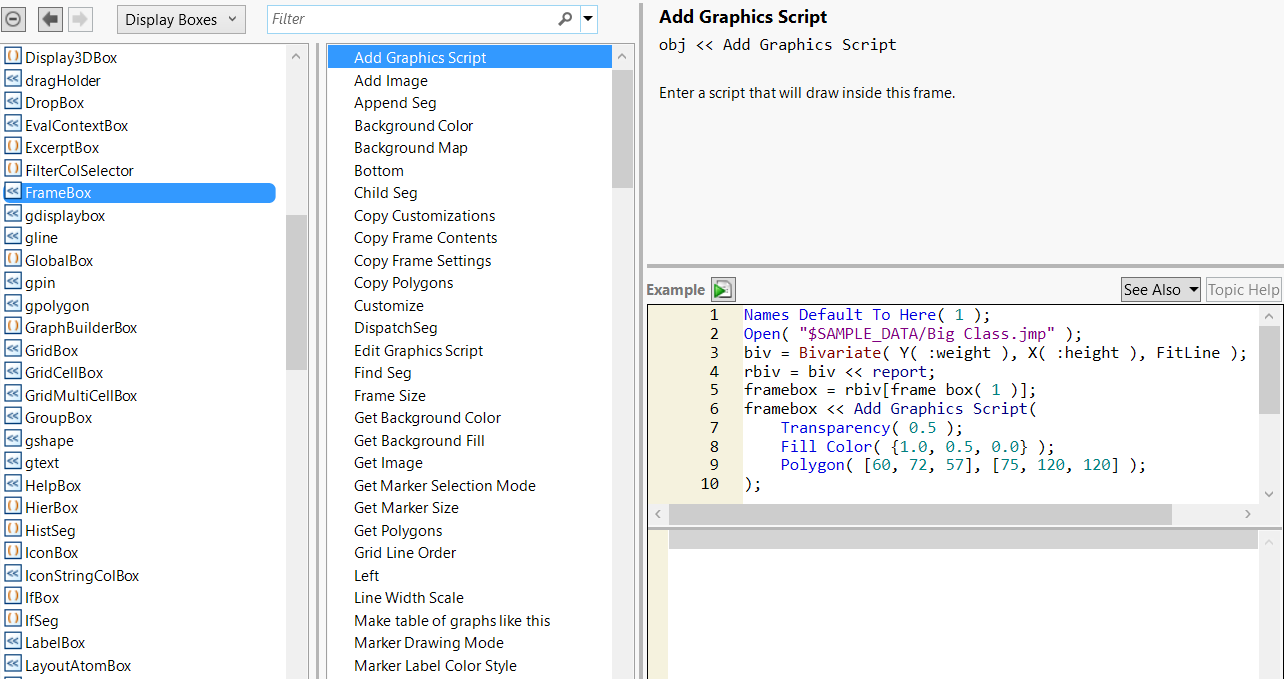
To find out which messages you can send to a frame box, select Help > Scripting Index and search for “frame box” (Figure 10.6).
Figure 10.6 Scripting Index Display Box List
Running the Show Properties() function is an alternative to using the Scripting Index. The messages for the specified display box are printed to the log.
dt = Open( "$SAMPLE_DATA/Big Class.jmp" );
biv = dt << Bivariate( Y( :weight ), X( :height ) );
Show Properties( biv );
Show Points [Boolean] [Default On]
Histogram Borders [Boolean]
Fit Mean [Action](Fits a flat line at the mean.)
...
Many messages are the same as items in the pop-up menu for a given object. The next section, Construct Custom Windows, discusses messages for common display boxes in more detail.
var = Outline Box[2];
var = report[text];
This expression finds the display box in rpt that has the title text. Note that text must be the complete title, not just a substring of the title. The "text" argument can also be any expression that evaluates to a text string. This approach is less reliable than referring to the display box with a subscript because the string in a report can easily change.
var = rbiv["Analysis of Variance"];
dt = Open( "$SAMPLE_DATA/Big Class.jmp" );
biv = dt << Bivariate(
Y( :weight ),
X( :height ),
Fit Mean( {Line Color( {57, 177, 67} )} ),
Fit Polynomial( 4 )
);
rbiv = biv << Report; // return a reference to the Bivariate report
out1 = rbiv["? Mean"]; // find "Fit Mean" in the Bivariate report
out1 << Close( 0 ); // open the Fit Mean outline
var = rbiv[Display Box( "?text" )];
This expression finds the outline box that contains the specified text string in the rbiv report. The out1 variable assigns a reference to the outline box.
out1 = rbiv[Outline Box( "? Mean" )];
rpt[Display Box ( n )];
The expression above finds the nth of the specified display box of the type boxType. For example, this expression finds the first outline box in the rbiv report and assigns it to the out1 variable:
out1 = rbiv[Outline Box( 1 )];
Tip: To determine the index number of a display box, view the tree structure as described in View the Display Tree.
var = rpt[arg1][arg2][arg3][...];
The expression above matches the last argument to a display box that is contained by the next to last argument’s outline node, which is in turn contained by the argument before the next to last, and so on. In other words, it is a way of digging down into the hierarchy of an outline tree to identify a nested display box.
If you want to identify an item nested several layers down in an outline box, use a subscript with more than one argument of any of the above types. After locating the first item, JMP looks inside that item for the next, and so on.
rpt[arg1][arg2][arg3] // finds the first item then the next starting after that location, and so on
rpt[arg1, arg2, arg3] // different syntax, same result
out = rbiv["Polynomial Fit Degree=4"]["Parameter Estimates"][1][3] << Select;
Example of Creating a Report shows how to extract parameter estimates from the report.
dt = Open( "$SAMPLE_DATA/Big Class.jmp" );
rp = dt << Bivariate(
Y( :weight ),
X( :height ),
Fit Line( {Line Color( {213, 72, 87} )} )
);
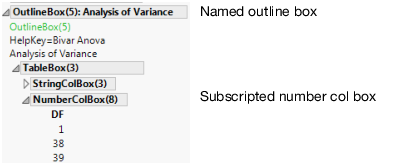
Print(
"C.Total DF=",
Report( rp )[Outline Box( "Analysis of Variance" )][
// string references the parent box
Number Col Box( 1 )][3] // subscript references the child box
);
Figure 10.7 Subscripted Display Box