A choice response consists of a set of rows, uniquely identified by the Grouping columns. An indicator column is specified for Profile ID in the Choice Dialog box. This indicator variable uses the value of 1 for the chosen profile row and 0 elsewhere. There must be exactly one “1” for each Grouping combination.
This example illustrates how the pizza data are organized for the one-table situation. Partial Listing of Combined Pizza Data for One-Table Analysis shows a subset of the combined pizza data.
|
1.
|
Each subject completes four choice sets, with each choice set or trial consisting of two choices. For this example, each subject has eight rows in the data set. The indicator variable specifies the chosen profile for each choice set. The columns Subject and Trial together identify the choice set, so they are the Grouping columns.
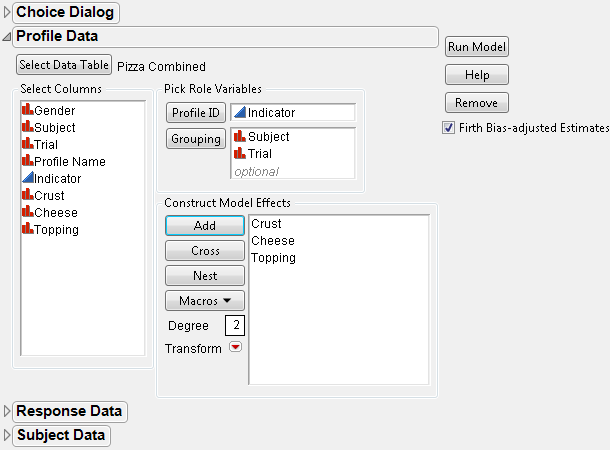
To analyze the data in this format, open the Profile Data section in the Choice Dialog box, shown in Choice Dialog Box for Pizza Data One-Table Analysis.
|
2.
|
Select Analyze > Consumer Research > Choice.
|
|
3.
|
Click Select Data Table.
|
|
4.
|
|
5.
|
In the Profile Data section of the window, specify Indicator as the Profile ID, Subject and Trial as the Grouping variables, and add Crust, Cheese, and Topping as the main effects.
|
|
6.
|
Click Run Model.
|
|
7.
|
|
8.
|
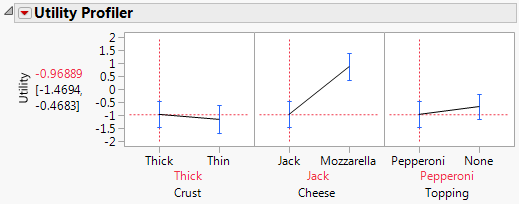
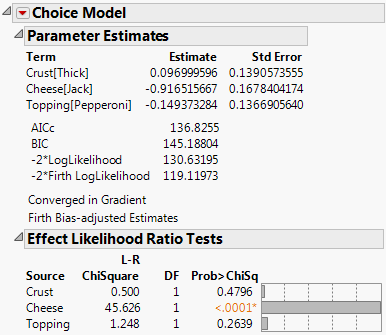
Select Utility Profiler from the drop-down menu to obtain the results shown in Utility Profiler for Pizza Data One-Table Analysis. Notice that the parameter estimates and the likelihood ratio test results are identical to the results obtained for the Choice Model with only two tables, shown in Choice Model Results with No Subject Data for Pizza Example.
|